8 best Shopify analytics apps, sorted by the question each one answers
Data as of November 2026. Prices and ratings come from each app's Shopify App Store listing or its maker's site, read November 3, 2026.
Summarize with AI
You stared at your Analytics page for an hour and still can't say what to fix first. The eight tools below answer five questions, so start with yours.
The best Shopify analytics app depends on the question you opened your reports with. Shopify Analytics answers what sold, free on every plan. Sledge shows where visits end and what to change, from $29.99 a month. Google Analytics and Polar Analytics trace which campaign paid off. Lifetimely and TrueProfit work out profit, and Microsoft Clarity and Lucky Orange record visits.
At a glance
What is the best analytics app for Shopify?
It depends on your question. Prices are as of November 2026.
| App | The question it answers | Best for | Free plan | Rating (reviews) |
|---|---|---|---|---|
| Shopify Analytics | What sold, and from which channel? | Your daily look at what sold and from where | Built into every plan | Built in |
| Sledge | Which page loses the sale, and what do you change? | Finding what to change on your own pages | Development stores only | 4.5 (17) |
| Google Analytics | Which visit or ad paid off? | Free traffic and campaign reports | Yes | 4.5 (5,594), for Google & YouTube |
| Polar Analytics | Which visit or ad paid off? | Spending on ads across several channels | No | 4.9 (116) |
| Lifetimely | What profit is left? | Profit and lifetime value, starting free | To 50 orders a month | 4.9 (590) |
| TrueProfit | What profit is left? | Net profit with every cost counted, from $35 a month | No, 14-day trial | 4.9 (923) |
| Microsoft Clarity | Why did shoppers leave? | Watching visits for $0 | Yes, the whole app | 4.6 (2,468) |
| Lucky Orange | Why did shoppers leave? | Recordings plus surveys that ask shoppers why | 100 sessions a month | 4.6 (906) |
- What sold today, and from which channel? Shopify Analytics, at no extra cost.
- Which page loses the sale, and what do you change? Sledge, from $29.99 a month after a 14-day free trial.
- Which visit or ad paid off? Google Analytics, free through the Google & YouTube app, or Polar Analytics for several ad channels, from $750 a month.
- What profit is left? Lifetimely, free up to 50 orders a month, or TrueProfit from $35.
- Why did shoppers leave? Microsoft Clarity records visits, free. Lucky Orange adds surveys that ask them, from $19.
1 · Shopify Analytics
Shopify Analytics: what sold, and from where?
You want today's sales, sessions and conversion rate without installing anything. Shopify Analytics is already in your admin on every plan, and staff see it once you give them Analytics permission.
The Analytics page puts sales, sessions and fulfillment in cards you can add, remove and rearrange, updated within about a minute. Shopify's pricing page lists 200+ real-time reports on Basic, Grow, Advanced and Plus.
Behavior reports include a conversion rate funnel from session to finished checkout, plus searches with no results and sessions by landing page and device. The Attribution page compares channels, campaigns and paths to purchase, and reports can credit a sale five ways, from first click to an even split across every click. Profit reports show gross profit by product and margin by order. Sidekick, Shopify's assistant, answers questions about sessions, such as conversion rate, but not about search or recommendations.
Profit counts only products with a cost per item entered. Ad spend and return on ad spend show only for ad platforms that send their costs to Shopify. Marketing reports can take up to 24 hours to update.
The seven tools below answer what these reports leave open.
Best for: your daily look at what sold and from where.
2 · Sledge
Sledge: which page loses the sale, and what do you change?
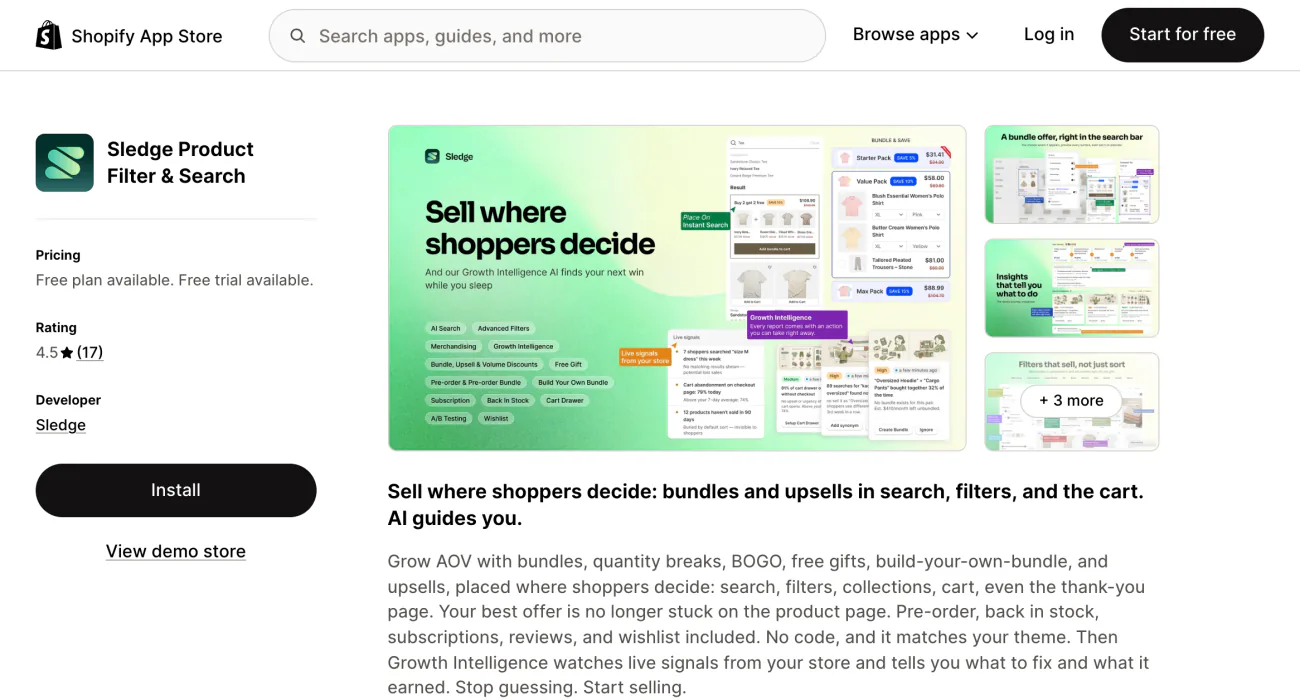
Your conversion rate dipped and you can't tell which page lost the sale. Sledge Analytics shows where visits end inside your store, flags the ones worth a look and points you to the fix.
Sledge is a Shopify app for search, filters and offers, and its Analytics reports what shoppers do on your own pages. Its five tabs are Overview, Journey, Surfaces, Tools and Signals. Overview opens on "Revenue from Sledge", the sales credited to Sledge tools, then sessions, add-to-cart rate, conversion rate and average order value.
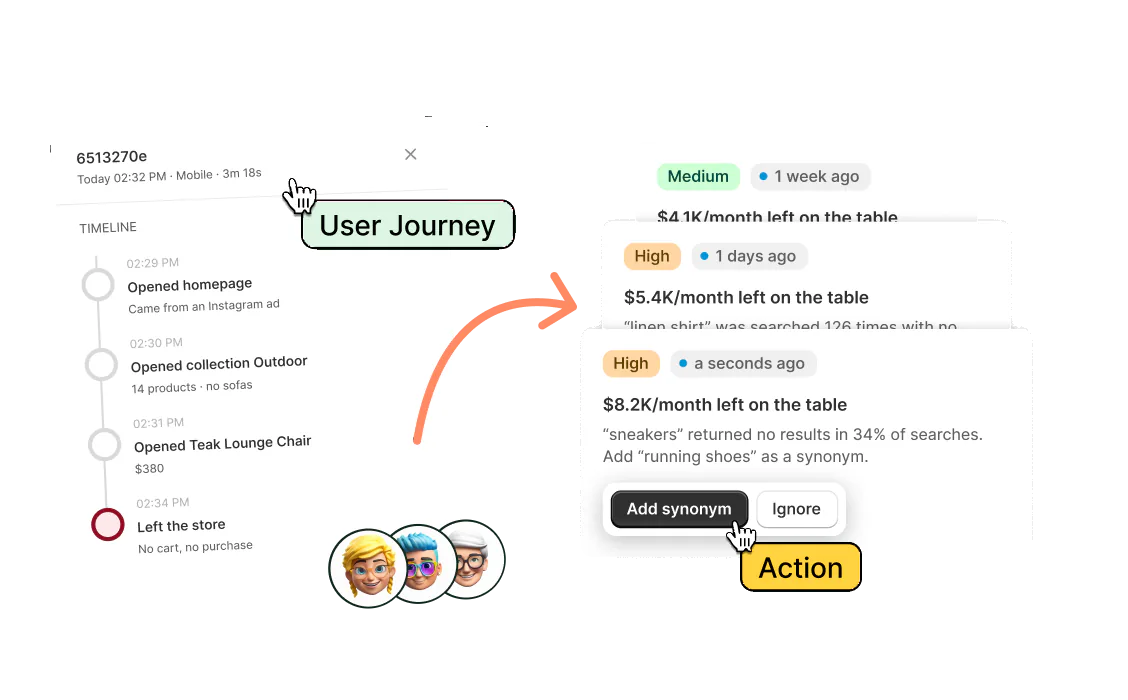
For each kind of page, Journey counts the visits that ended there and gives an exit rate. It also ranks where visits with no purchase stopped, most common page first. It flags individual visits with a reason, such as "Searched, found nothing". Open one to see its steps in order, from a filter applied, to an item added to the cart, to the moment the shopper left.
Signals lists what Sledge spots, and most entries carry a button to the page where you fix it. "Search with no results", for example, carries the button "See no-result searches".

Surfaces gives eight kinds of page four numbers each: product pages, for example, show sessions, add-to-cart rate, views of sold-out products and revenue. Tools gives each of 11 Sledge tools its own card, from search to product reviews. Overview's "Revenue by Sledge tool" list splits the credited sales, and a bundle sale counts for the bundle tool. Any other product counts for the last Sledge tool that drew a click, an add to cart or a quick view on it in the seven days before the order, and a product no tool touched counts for none.
Analytics works from the first day of the 14-day free trial, with 14 days of history. Paid plans keep 30 days on Pro, 60 on Scale, 90 on Accelerate and 120 on Ultimate, and each exports your data to CSV. Plans run from Pro at $29.99 a month to Ultimate at $399, compared on Sledge pricing.
Growth Intelligence, Sledge's advisor, runs on paid plans only: weekly on Pro, twice a week on Scale and daily on Accelerate and Ultimate.
Sledge has no heatmaps and records no video of a visit. It doesn't credit sales to ad channels or work out profit. Its App Store listing is "Sledge Product Filter & Search".
Best for: finding what to change on your own pages.
3 · Google Analytics
Google Analytics: where did your visits come from?
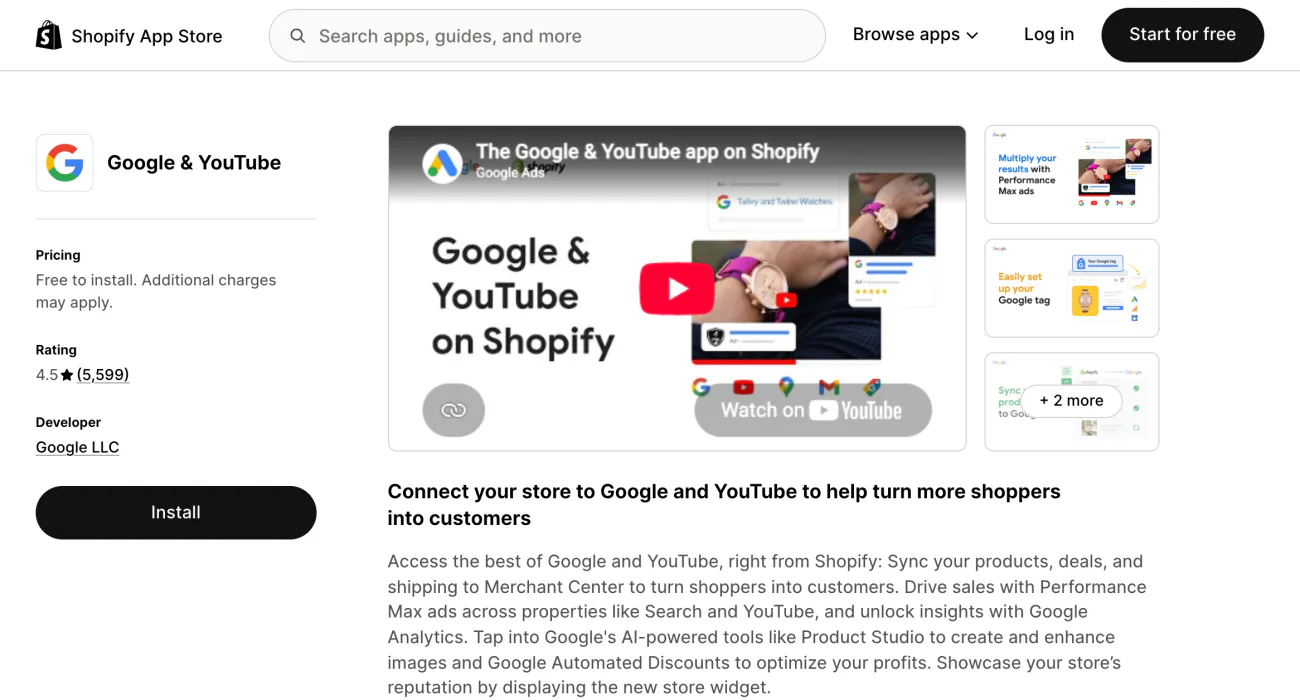
Your Shopify reports count the visits, and you want to follow each campaign and landing page further. Google Analytics does that for free, connected through the Google & YouTube app.
First create a Google Analytics account and a Google Analytics 4 property, the space your store's data goes into. Then install Google & YouTube and follow Google's setup steps, Shopify Help says. You don't need Merchant Center. Google Analytics then tracks some shopper actions without more setup.
The app is free to install. Google ads you run are billed to your Google Ads account.
Expect Google Analytics' visit counts to differ from Shopify's. It tracks nothing until you turn off private mode, the password on your online store.
Best for: free traffic and campaign reports.
4 · Polar Analytics
Polar Analytics: what did each ad bring in?
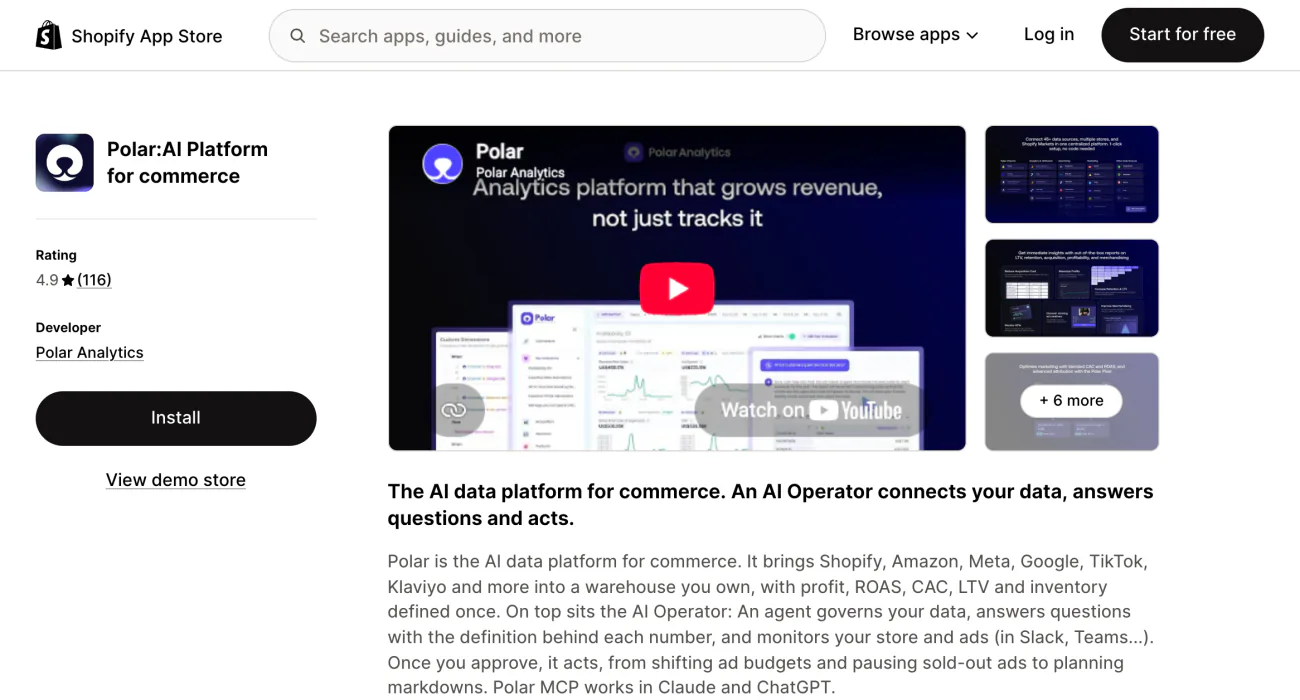
You spend on Meta, Google and TikTok, and each dashboard claims the same sale. Polar Analytics puts your store, ad and email data in one place, with profit, return on ad spend and lifetime value worked out one way for all of them.
Its listing names Shopify, Amazon, Meta, Google, TikTok and Klaviyo as sources, and says you own the data it gathers. It tracks contribution margin and cohorts by channel and product, and a blended cost to win a customer across channels. An AI Operator in Slack can move ad budget or pause an ad after you approve, the listing says. For other AI tools, see which jobs AI can do for your store.
One plan, Core, starts at $750 a month, priced by your online sales, with discounts for yearly terms. Polar's own pricing page asks for your yearly sales and sells every plan by demo.
Polar may bill you outside your Shopify invoice. More ad and profit tools sit in seven Triple Whale alternatives.
Best for: spending on ads across several channels.
5 · Lifetimely
Lifetimely: what profit is left?
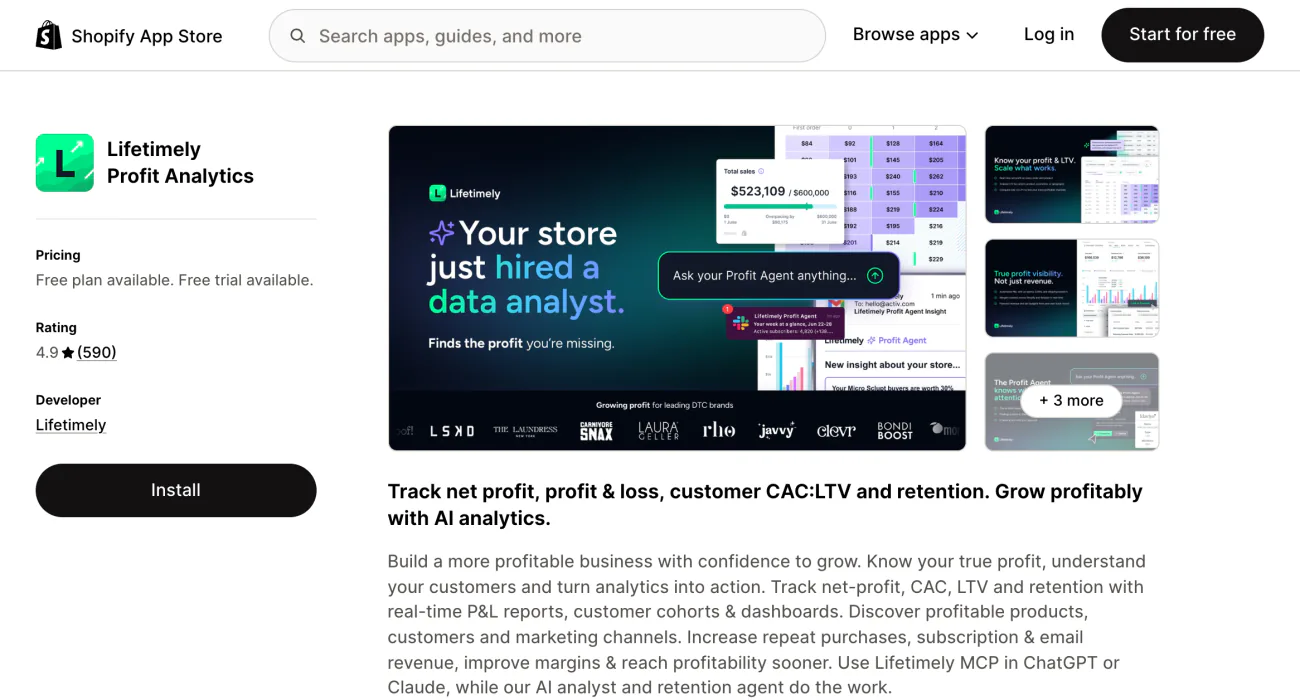
Revenue is up and you still can't say what you kept after product costs, shipping and ads. Lifetimely turns those costs into a daily profit and loss statement, and shows when a new customer has earned back what it cost to get them.
The free plan includes daily profit and loss, custom reports, a lifetime value forecast and benchmarks. Lifetimely's own site limits it to 50 orders a month. Paid plans follow your order count: S at $49 for up to 500, M at $149 for 3,000 and L at $299 for 7,000, each with a 14-day free trial.
It connects to Google Ads, Meta Ads, Klaviyo, QuickBooks Online, Recharge and TikTok. Amazon data costs $75 a month more.
Best for: profit and lifetime value, starting free.
6 · TrueProfit
TrueProfit: what did you keep after every cost?
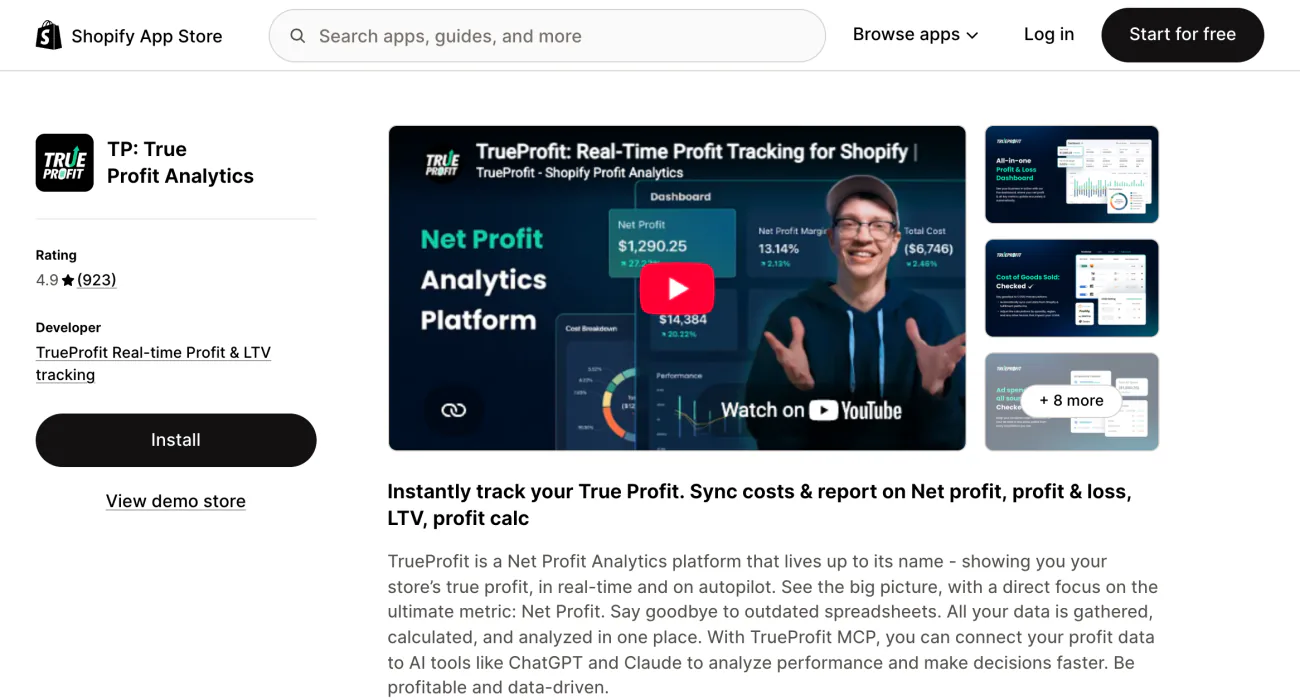
You want one net profit number, with fees, shipping and ad spend taken out. TrueProfit counts product costs, shipping, payment fees, taxes and any cost you add. It pulls in ad spend from six platforms: Facebook, Google, TikTok, Bing, Snapchat and Amazon.
Basic includes the profit dashboard and lifetime value. Advanced adds net profit for each product and a profit and loss report, and Enterprise adds marketing attribution, the net profit of each ad.
Plans step up by orders: $35 a month for 300 on Basic, $60 for 600 on Advanced, $100 for 1,500 on Ultimate and $200 for 3,500 on Enterprise, each with a 14-day free trial. Every order past the limit adds a fee: $0.30 each on Basic, and those fees stop at $300.
There's no free plan.
Best for: net profit with every cost counted, from $35 a month.
7 · Microsoft Clarity
Microsoft Clarity: what did shoppers do before they left?
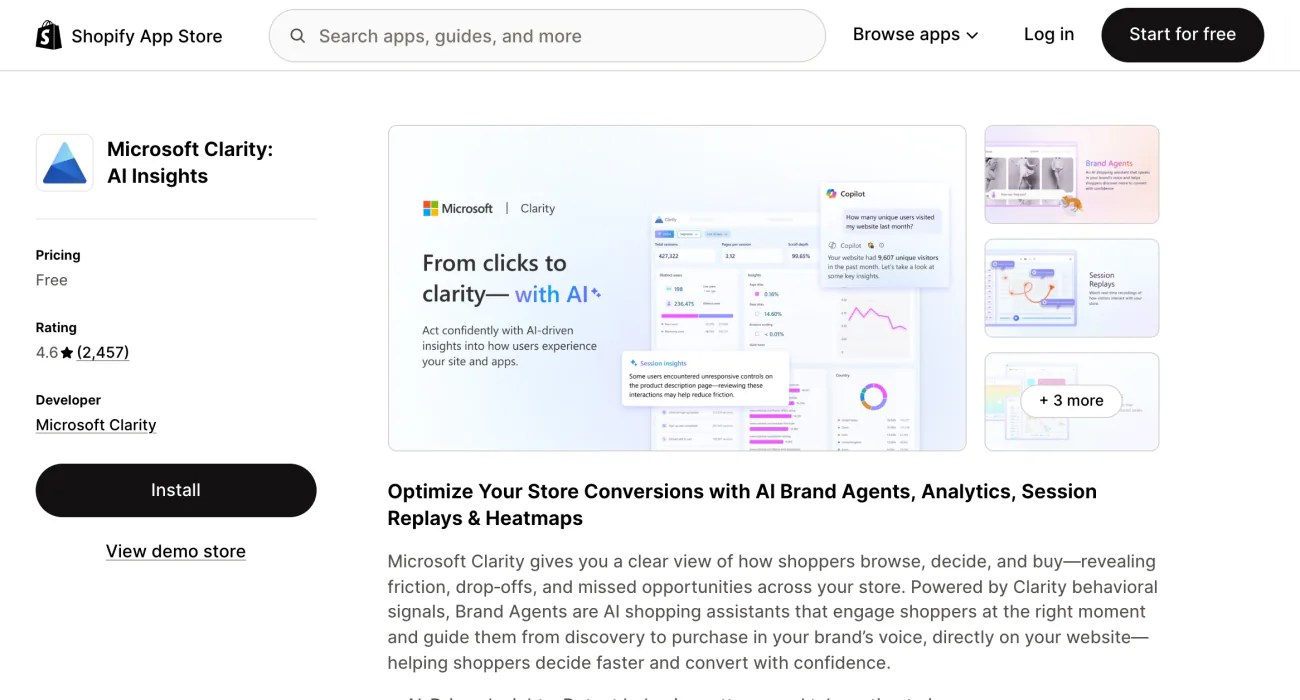
Your exit numbers say shoppers left the product page, not whether they hunted for a size chart first. Microsoft Clarity records visits and draws heatmaps for free.
Its listing also names AI insights, smart events and conversion funnels. Microsoft says Clarity doesn't sample, so every recorded visit is in the numbers.
It records up to 100,000 sessions a day for each Clarity project and keeps data for up to 30 days. A heatmap covers up to 100,000 pageviews. In the EEA, the UK and Switzerland, a shopper has to say yes to cookies before Clarity places any.
Best for: watching visits for $0.
8 · Lucky Orange
Lucky Orange: can you ask shoppers why they left?
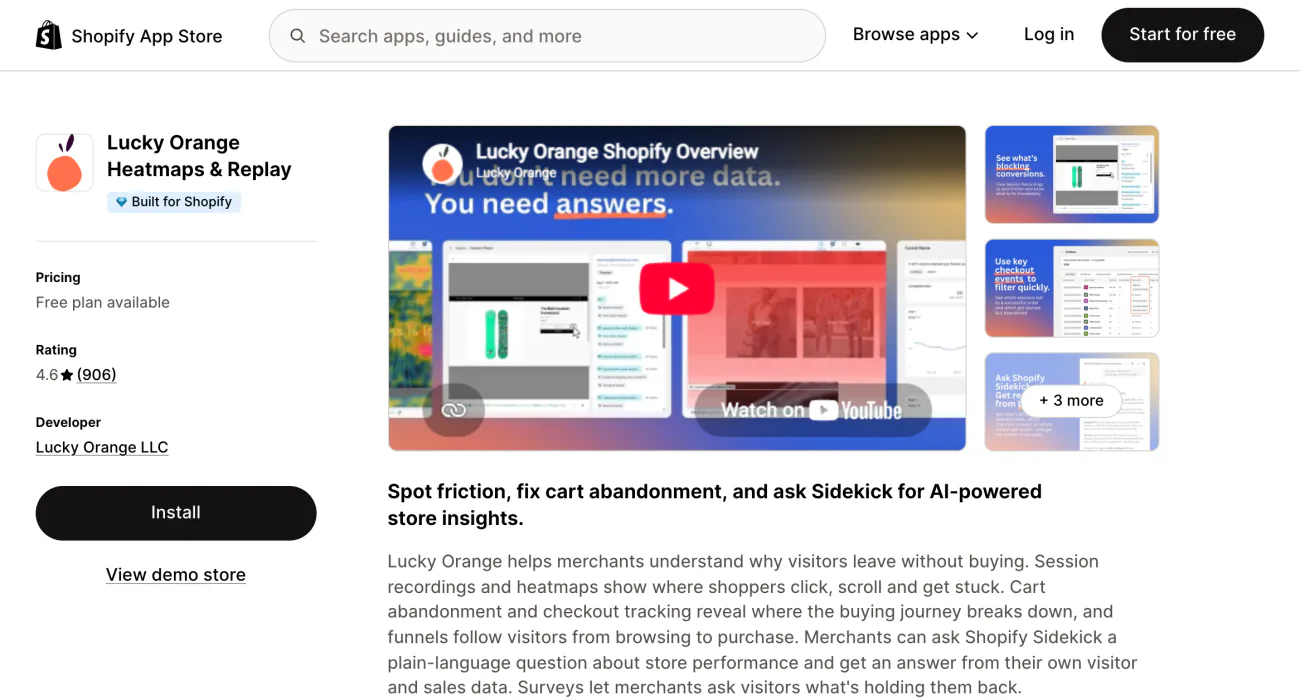
Recordings show what shoppers did, and you still want to hear why. Lucky Orange adds surveys to its recordings and heatmaps, and tracks where checkouts drop off, by product and by step.
Its listing carries the Built for Shopify badge. Free covers 100 sessions a month, with 30 days of data. Launch costs $19 for 500 sessions, Build $39 for 3,500 and Grow $89 for 10,000, and the last two keep 60 days of data. Discovery AI costs $5 to $20 a month more, by plan, and paying yearly saves 20%.
Five more recording apps sit beside Clarity in Lucky Orange alternatives.
Best for: recordings plus surveys that ask shoppers why.
The monthly bill
What does each analytics app cost at 300 orders a month?
Say your store takes 300 orders and 10,000 sessions a month.
| App | What the bill counts | At 300 orders and 10,000 sessions |
|---|---|---|
| Shopify Analytics | Your Shopify plan | $0 extra |
| Sledge | One monthly plan | $29.99 (Pro) |
| Google Analytics | Nothing; ad spend goes to Google Ads if you run campaigns | $0 |
| Polar Analytics | Online sales | From $750 |
| Lifetimely | Orders | $49 (S, up to 500) |
| TrueProfit | Orders, plus a fee per order over the limit | $35 (Basic, 300 orders) |
| Microsoft Clarity | Nothing | $0 |
| Lucky Orange | Sessions | $89 (Grow, 10,000) |
Three of those counts rise as your store grows. Polar Analytics counts your online sales, Lifetimely and TrueProfit your orders, and Lucky Orange your sessions.
Each Sledge plan has a monthly ceiling. Pro covers a Monthly Revenue Boost, the sales credited to Sledge in a month, of up to $8,000. Past it, until the month resets, Growth Intelligence pauses new suggestions and search stops reading questions typed as sentences. Search itself and every other storefront tool keep running.
Session counts
Why does every tool show a different session count?
Shopify Help gives the reasons: Shopify, Google Analytics and your heatmap app each count reloads, unique visitors and sessions their own way, some shoppers block cookies or tracking, and time zones differ. On September 21 to 23, 2026, Shopify also changed how it counts sessions, so its numbers can shift from that week on while traffic and orders stay the same.
So compare each tool with itself over time. Shopify records your orders and sales, so trust those numbers.
Where to start
Which number should you act on first?
The searches that find nothing come first: each one is a shopper who typed what they wanted. Say 40 searches a week find nothing, and one in ten of those shoppers would have bought a $60 shirt. That's about $1,040 a month walking out. For the other checks, run a Shopify store audit. Then track eight ecommerce KPIs, each with the report that shows it.
Growth Intelligence turns on when you pick a paid plan. It reads your orders, searches and visits, suggests fixes, and adds the sales they could bring in each month into one total labeled "Est. potential". Once a fix is live, Sledge compares your sales after the change with an equal stretch before it.
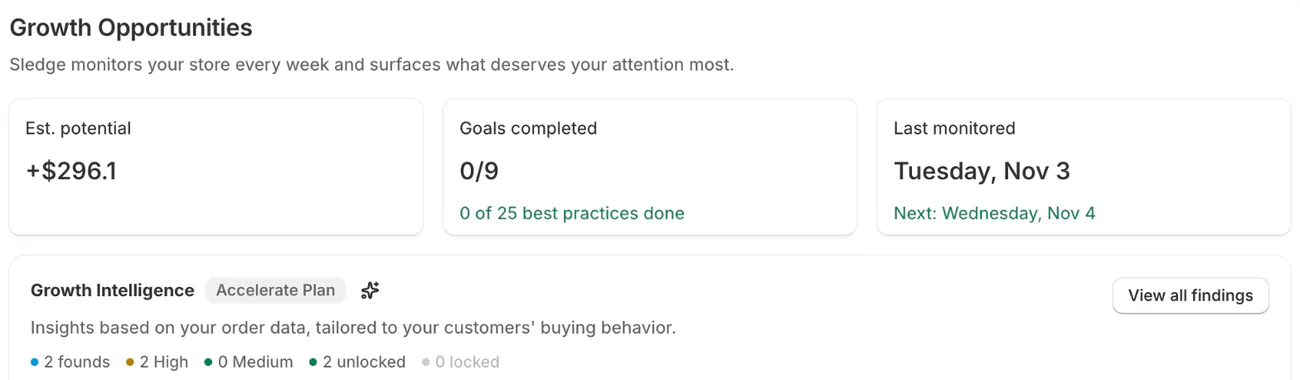
Try Sledge free for 14 days, then pick a paid plan to see your own total.
FAQ
Questions, answered
-

14-day free trial
Explore Sledge on your store before you decide to commit.
-

No credit card required
Start improving your store with no upfront commitment.
-

Setup in minutes
Get Sledge running without a lengthy setup process.
-

Built to grow sales
Turn shopper behavior into actions that help you sell more.
What is the best analytics app for Shopify?
The best Shopify analytics app depends on your question. Shopify Analytics answers what sold and from which channel, free on every plan. Sledge shows where visits end in your store and what to change, from $29.99 a month. Google Analytics tracks where visits came from, and Lifetimely or TrueProfit work out what you kept after costs.
Is Shopify's built-in analytics enough for a small store?
Often, yes. Every Shopify plan includes the Analytics dashboard and reports: sales, sessions, a funnel from visit to finished checkout, searches with no results and, once you enter a cost per item, gross profit. Add an app when you have a question those reports leave open, such as which page a visit ended on or what you kept after ads.
What is the best free analytics app for Shopify?
Three add nothing to your bill. Shopify Analytics comes with your plan, Google Analytics is free through the Google & YouTube app, and Microsoft Clarity records visits and draws heatmaps with no paid plan at all. Lifetimely is free up to 50 orders a month and Lucky Orange up to 100 sessions. Sledge is free on development stores only. More are in free Shopify apps.
What is the best profit analytics app for Shopify?
Three apps here work out profit. Lifetimely builds a daily profit and loss report, free up to 50 orders a month, then $49 for up to 500. TrueProfit starts at $35 for 300 orders, plus a fee per extra order. Polar Analytics adds ad data from $750 a month. Shopify's profit reports need a cost per item on each product.
Does Shopify Analytics show bounce rate?
Yes. Bounce rate is a metric in Shopify's reports: the share of online store visits that ended after one pageview. Add it to the Sessions by landing page report to see which pages lose visitors right away. Shopify changed how it counts sessions on September 21 to 23, 2026, so compare dates on the same side of that change.
Is Triple Whale still on the Shopify App Store?
Not as of November 3, 2026. Its listing reads "This app is not currently available on the Shopify App Store" and shows no price or install button. It asks you to contact Triple Whale directly, so if you already run it, check your plan with them. Seven Triple Whale alternatives are compared on their own page.
Put a dollar total on what to change first
On any paid plan, Growth Intelligence reads your orders, searches and visits, then adds its suggested fixes into one dollar total labeled “Est. potential”.