Ecommerce KPIs are the few numbers you pick to run your store by. On Shopify, eight cover most of it: conversion rate, average order value, cart abandonment, returning customer rate, customer lifetime value, searches with no results, sales by source and gross margin. Each has a plain formula and a report under Analytics to work it from.
Sessions are up this week and sales are flat. You open conversion rate, then average order value, then repeat customers, and twenty tabs later nothing points at what to fix. Eight numbers are enough. Shopify's reports already hold what you need for all eight, though a few are worked out differently from the formula you know.
What are ecommerce KPIs, and which ones matter?
A metric is any number your reports show. A KPI is a metric you tied to a goal, so you act when it moves. From the Basic plan up, Shopify comes with more than 200 reports, and the work is picking the few that point at a fix.
These eight cover traffic, orders, customers, search and profit. The last column is our suggestion for how often to look, not a benchmark.
| KPI | Formula | Shopify report (category) | Look at it |
|---|---|---|---|
| Conversion rate | sessions that completed checkout ÷ sessions | Conversion rate over time (Behavior) | Weekly |
| Average order value | (gross sales minus discounts) ÷ orders | Average order value over time (Sales) | Weekly |
| Cart abandonment | 1 minus (sessions that completed checkout ÷ sessions with cart additions) | Conversion rate breakdown (Behavior); the Abandoned checkouts list under Orders | Weekly |
| Returning customer rate | returning customers ÷ customers who ordered | New vs returning customers (Customers) | Monthly |
| Customer lifetime value | AOV × orders a year × years they keep buying | Customer cohort analysis, set to Amount spent per customer (Customers) | Every quarter |
| Searches with no results | searches that found nothing ÷ all searches | Searches with no results; Searches by search query (Behavior) | Weekly |
| Sales by source | sessions, orders and conversion rate for each channel | Performance by marketing channel (Marketing) | Weekly |
| Gross margin | (net sales minus cost of goods sold) ÷ net sales | Gross profit by product (Profit Margin) | Monthly |
Report names, and the formulas Shopify defines, as Shopify's Help Center printed them on November 4, 2026. The admin showed the same categories that day. The cart abandonment and no-results formulas are worked out from those reports, and the lifetime value formula is a common rule of thumb, not a Shopify metric.
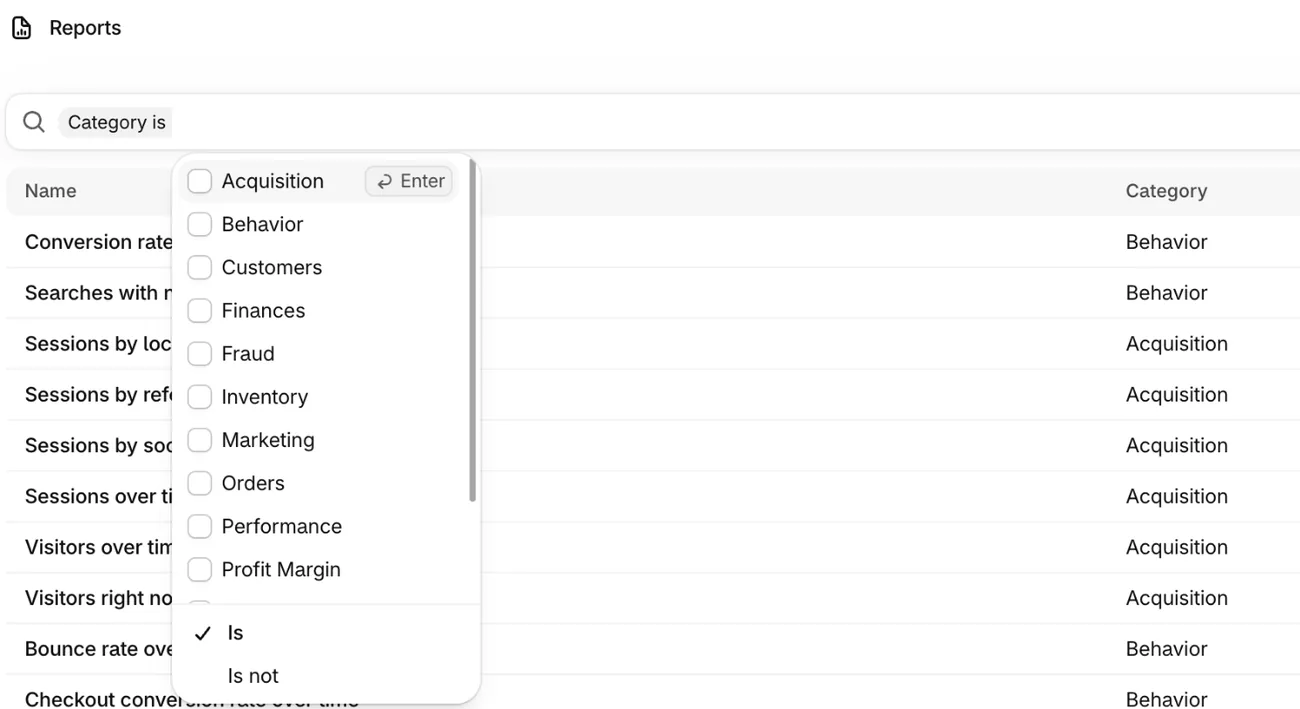
Open any of these reports under Analytics, then Reports: click the "Search reports" box and pick Category to narrow the list. Its menu holds 13 report groups, and Sales sits below Profit Margin, so scroll down to find it.
Conversion rate: how many visits end in an order?
Shopify divides sessions that completed checkout by all sessions. Say your clothing store had 4,000 sessions this week and 72 ended in an order: your conversion rate is 1.8%. You'll find it in "Conversion rate over time", under Behavior.
Shopify counts a session only when the visitor accepts cookies in your cookie banner. A shopper who declines can still buy: the order counts in your sales, never in the rate. After a new cookie banner, read your orders before you trust a change in your conversion rate.
Shopify also changed how it counts sessions on September 21 to 23, 2026, so compare only weeks after that.
Average order value: what does each order bring in?
Shopify works out average order value as gross sales minus discounts, divided by orders. Say 200 orders brought in $9,000 in gross sales, with $600 in discounts: your AOV is $42. "Average order value over time", under Sales, tracks it.
Shopify's figure leaves out tax and shipping, plus any edit or exchange made after the order. Divide total sales by orders yourself and you usually get more, because total sales adds tax and shipping. When your AOV looks too low, check what you divided before you change a price.
Cart abandonment: how many carts never become orders?
Shopify prints no cart abandonment rate, so you work it out from "Conversion rate breakdown", the four-step funnel from all sessions to completed checkout. Switch "Open Funnel" off: a session then counts at a step only if it went through every step before it. Abandonment is the share of sessions with cart additions that never completed checkout.
Say 300 sessions added to cart and 66 completed checkout: 234 carts, or 78%, never became orders. The average across 50 studies is 70.22%, in Baymard Institute's list last updated September 22, 2025.
The Abandoned checkouts list, under Orders, shows a different, usually smaller number. It holds only checkouts where the shopper typed an email and then stopped for more than ten minutes, and it deletes them after three months. Bots that fill carts can push your abandonment rate up, and Shopify filters out the ones it spots, not all of them.
To see why carts stall, read trust signals that stop cart abandonment. To win them back, use abandoned cart email subject lines and templates.
Returning customer rate: how many buyers come back?
Returning customer rate is returning customers divided by all customers who ordered in the period. A returning customer already had at least one order before. Say 380 customers ordered this month and 76 had ordered before: 20%. "New vs returning customers", under Customers, shows both counts.
"Most stores display 20-40%," says Shopify's Help Center. The reports and the fixes for a low rate are in how to get repeat customers.
Customer lifetime value: what is one customer worth over time?
The common rule of thumb for customer lifetime value is AOV × orders a year × years they keep buying. With the $42 AOV from above, a shopper who orders 1.5 times a year for three years is worth $189. In Shopify, "Customer cohort analysis", set to "Amount spent per customer", shows what each month's new buyers have spent since. Its "Show projections" forecast needs 24 months of store data, and Shopify warns it is no guarantee of future sales.
Searches with no results: how often does search come up empty?
Add up "Number of searches" in "Searches with no results", then in "Searches by search query", and divide the first total by the second. Say shoppers ran 1,200 searches and 96 found nothing: 8% of your searches hit a dead end. Both reports run up to 72 hours behind. If an app runs your store search, read that app's report instead.
Every search that finds nothing came from a shopper who typed what they wanted.
For the fixes, read how to find and fix zero-result searches. The other search numbers worth a look are in Shopify search analytics.
Sales by source: which traffic actually buys?
"Performance by marketing channel", under Marketing, is one report with sessions, sales, orders and conversion rate for each channel. "Sessions by referrer" counts visits only, with no sales. So when sessions rise and sales stay flat, check which channel grew before you change a page.
The same report shows ad spend, return on ad spend and customer acquisition cost for channels that send their costs to Shopify, such as a connected ad platform. A dash there means no cost data came in, not zero. Shopify changed how it labels some referring channels on October 18, 2026, so compare months by marketing channel, as Shopify suggests.
For ad and profit tools beyond Shopify's reports, see Shopify analytics apps sorted by question.
Gross margin: how much of each sale do you keep?
Gross margin is net sales minus cost of goods sold, divided by net sales. Say $10,000 in net sales cost you $6,000 in products: you keep 40%. "Gross profit by product", under Profit Margin, shows it product by product.
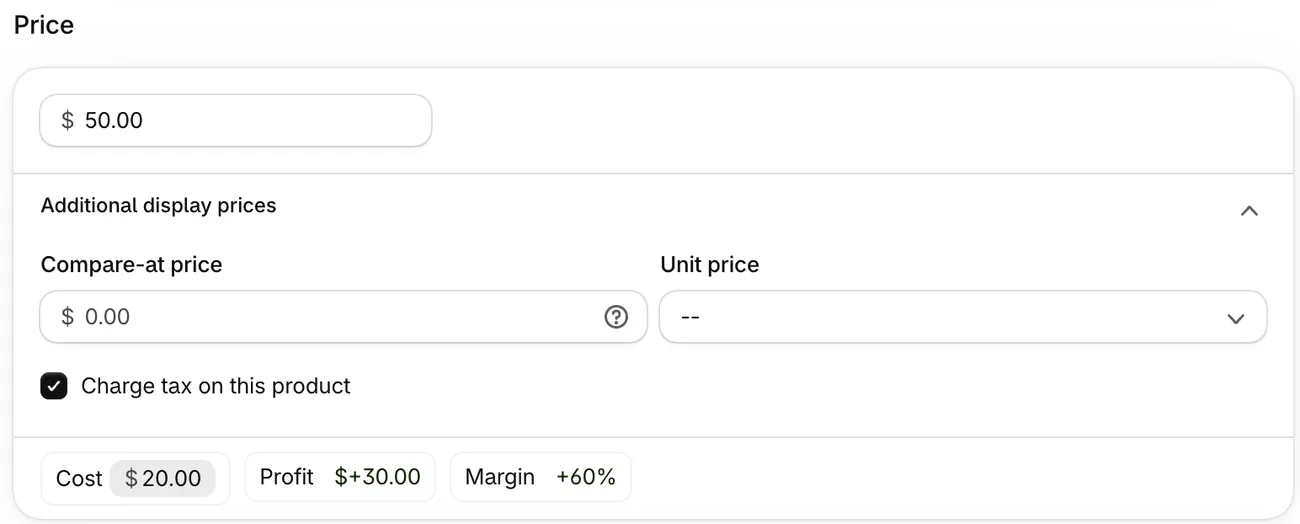
It needs what one unit costs you, entered under "Cost per item" in the Price section of each product, or of each size and color when a product has them. Shopify saves that cost on each order when the order is placed. In Finance Summary, the "Gross profit breakdown" card shows how much of your net sales had no cost recorded.
A sale made before you entered its cost stays out of your margin.
How often should you check each KPI?
Weekly: conversion rate, AOV, cart abandonment, searches with no results and sales by source. Monthly: returning customer rate and gross margin. Every quarter: lifetime value. When sales slip, start at the step where your funnel loses the most shoppers, which check 7 of a store audit finds.
"Create target", at the top of the Analytics page, turns a KPI into a number to hit by a date and shows your progress as a gauge. Targets take fixed amounts only, such as an average order value of $45 this month, and Shopify doesn't support growth rates.
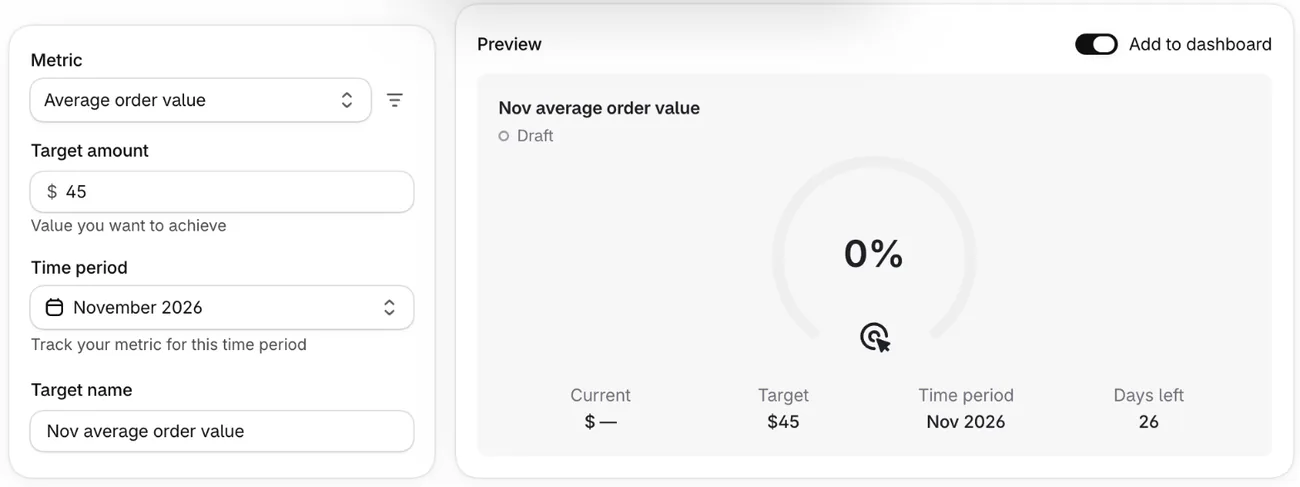
If your store has averaged at least 10 orders a week over the last six months, the Analytics page also posts insights when sales, AOV, returning customer rate or conversion rate trend up or down.
Return rate has a page of its own: handling ecommerce returns on Shopify.
What does Sledge add to these KPIs?
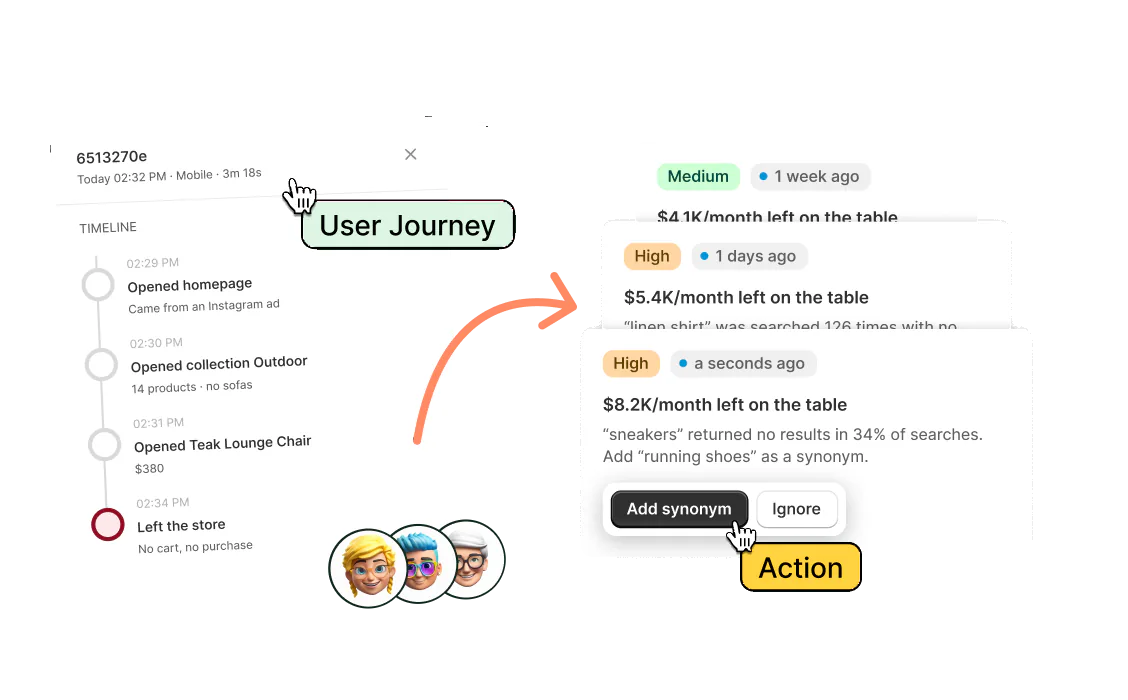
Sledge is a Shopify app for search, filters, merchandising and offers, and its Analytics covers what shoppers do inside your store. Its Signals tab can flag a search term that keeps finding nothing, and shoppers who clicked checkout but never ordered. The Overview tab shows Sessions, Add-to-cart rate, Conversion rate and Average order value. Those tiles count only visits where Sledge runs and orders its tools brought in, so expect different numbers from Shopify's. Growth Intelligence turns on when you pick a paid plan and suggests fixes from your store's orders and searches.
FAQ
Questions, answered
-

14-day free trial
Explore Sledge on your store before you decide to commit.
-

No credit card required
Start improving your store with no upfront commitment.
-

Setup in minutes
Get Sledge running without a lengthy setup process.
-

Built to grow sales
Turn shopper behavior into actions that help you sell more.
What are ecommerce KPIs?
Ecommerce KPIs, or key performance indicators, are the few numbers you choose to judge whether your store is on track. For a Shopify store, eight cover most of it: conversion rate, average order value, cart abandonment, returning customer rate, customer lifetime value, searches with no results, sales by source and gross margin.
What is the difference between a KPI and a metric?
A metric is any number your reports show, from pageviews to tax collected. A KPI is a metric you have tied to a goal and agreed to act on when it moves. From the Basic plan up, Shopify comes with more than 200 reports. Pick a handful of numbers as KPIs, so a bad week points at one thing to fix.
What are the most important ecommerce KPIs for a new store?
Start with three you can read every week: sessions, conversion rate and average order value. Together they roughly explain your sales: visits, times the share that buy, times what each order brings in. Add returning customer rate after a few months of orders, and gross margin once every product has a cost per item.
Why doesn't my average order value match total sales divided by orders?
Shopify works out average order value as gross sales minus discounts, divided by orders. Total sales also adds tax and shipping and takes off returns, so dividing it by orders usually gives a higher number. Edits and exchanges made after an order is placed are left out too. Read the Average order value over time report instead.
Can Shopify show customer acquisition cost and ROAS?
Yes, for some channels. The Performance by marketing channel report shows ad spend, return on ad spend and customer acquisition cost for channels that send their costs to Shopify, such as a connected ad platform. A dash means no cost data came in. For the rest, read your ad accounts or an analytics app that pulls in ad spend.
Can Sledge track ecommerce KPIs for me?
Partly. Sledge's Analytics shows sessions, add-to-cart rate, conversion rate and average order value for visits where Sledge runs and orders its tools brought in. Its Signals tab can flag searches that find nothing. It tracks no ad spend or margin, and shows lifetime value per shopper only. Growth Intelligence turns on when you pick a paid plan and suggests fixes.
See which number to fix first.
Try Sledge free for 14 days. Its Signals tab can flag searches that find nothing and checkouts that end without an order. Growth Intelligence turns on when you pick a paid plan, and the fixes it suggests add up to one estimated dollar figure, labeled "Est. potential".