
Revenue is up this month. You can see that. Now name the one thing on your store that earned it, and the one thing that's quietly losing money. You probably can't name either one. Your chart couldn't name them for you.
Analytics that names the move. Not just the number.
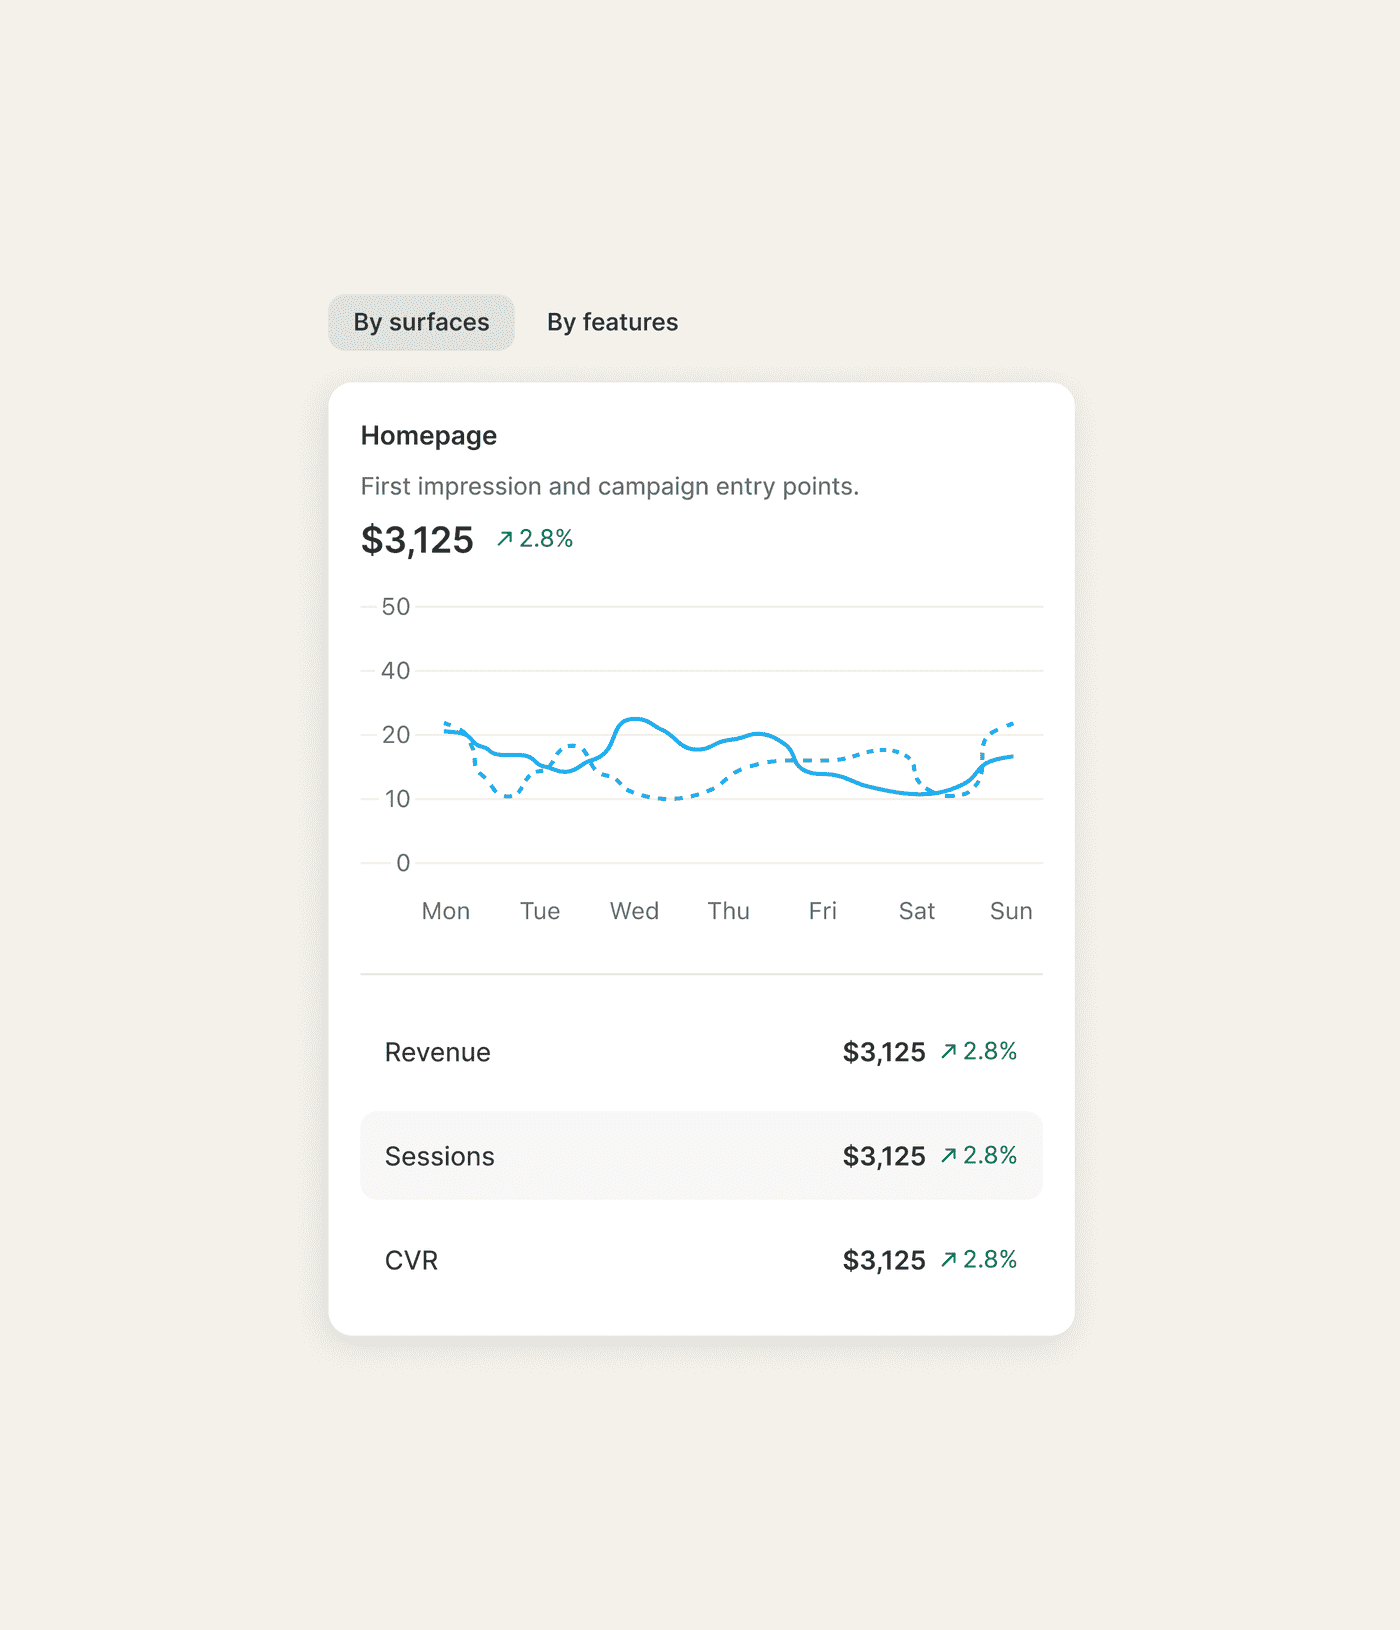
Sledge Analytics attributes revenue to each feature and each surface. A five-stage journey funnel shows the stage where shoppers drop off. Sledge Analytics pairs with Growth Intelligence, which turns the why into a specific move. You see which feature earned the sale, which page it earned it on, and where in the journey shoppers slip away.
14-day free trial · No code · Works with any theme · Uninstalls clean
// Attribution: which feature earned it
You're running ten things at once and you can't tell which one pays.
Search, filters, a bundle, a cart upsell, a couple of badges and a banner are all live. Each one costs you attention. You have no honest way to say which ones move money and which just sit there. So nothing gets cut, and the clutter grows.
Sledge Analytics attributes revenue to each feature it runs. The bundle earned this. Search earned that. Merchandising and the cart upsell each get their own number for last month. You see which on-site feature last touched the product before the sale, inside a seven-day window. You keep the one that earns.
Now the decision is easy. You double down on what pays and retire what doesn't. You stop running ten things on faith and run the three that earn.
// Surfaces: which page earned it
You know your store made sales. You don't know where they happened.
A sale is a sale, until you try to improve one. The search results might have closed it, or the collection page, or the cart. You can't tell which page earns and which one you keep sending shoppers to for nothing.
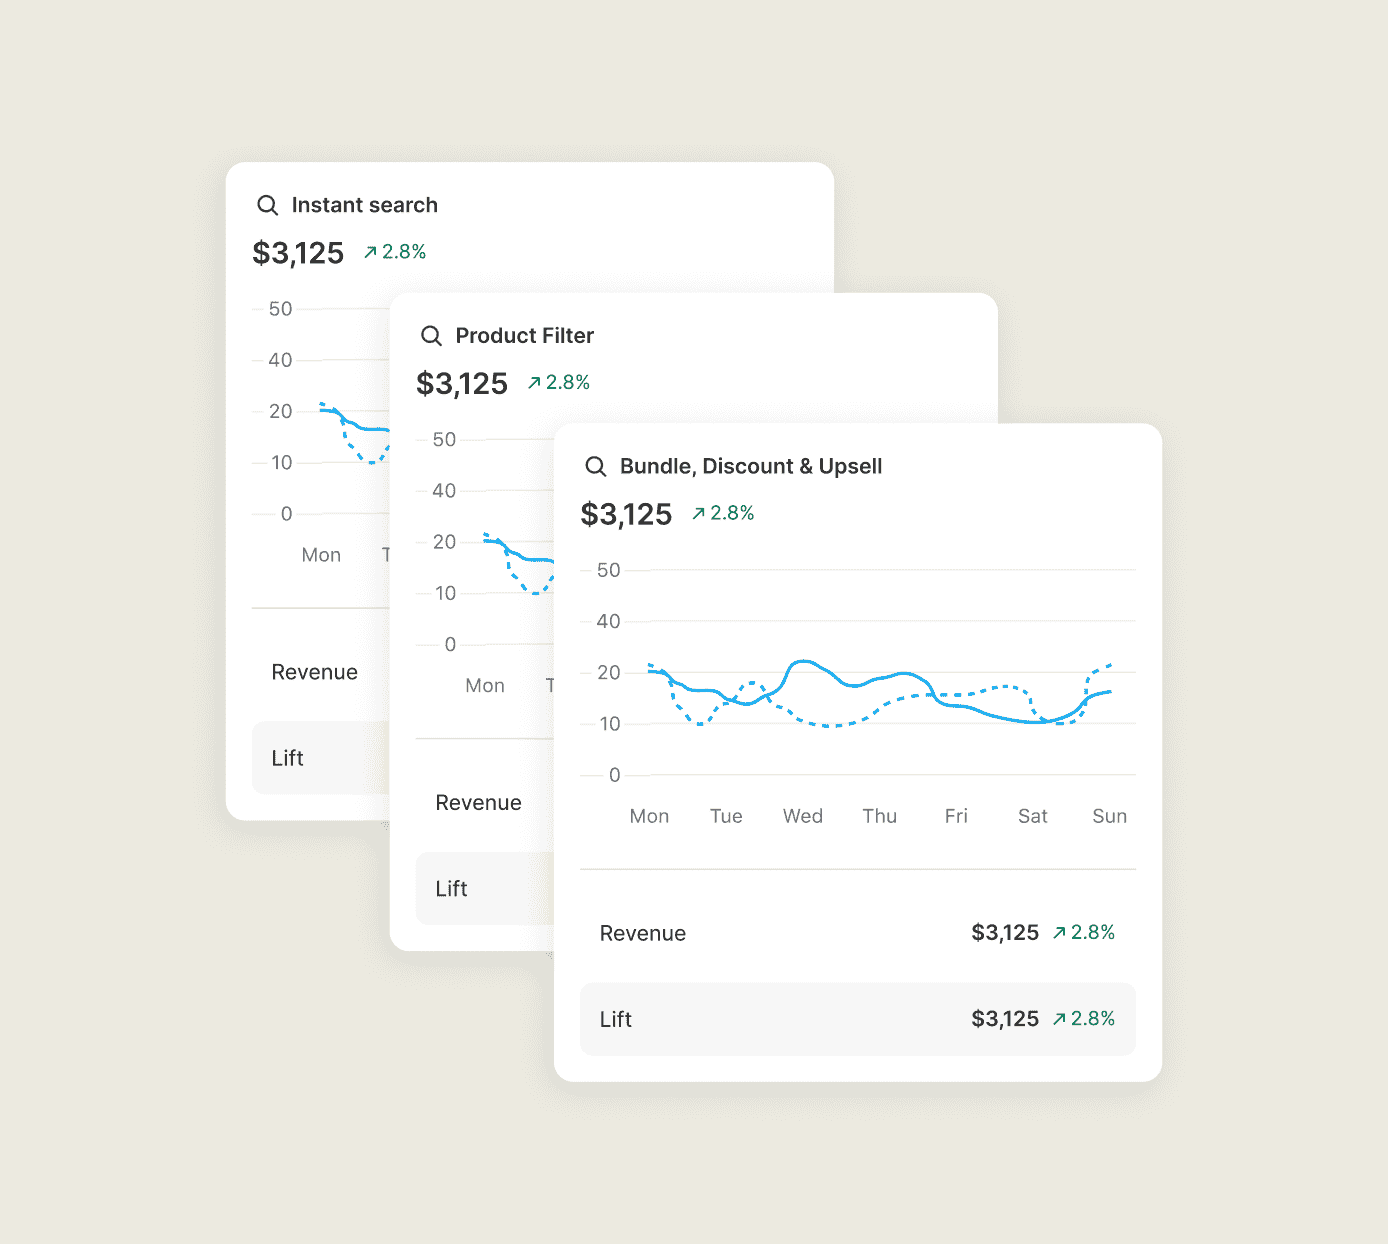
Sledge Analytics attributes revenue to each surface, the named places shoppers move through. Those are the search bar, search results, collections, the product page, the cart and the thank-you page. Each one shows what it earned, so you can see which page on your store earns the most.
Suppose the cart earns the most and the collection pages earn almost nothing. Now you know where to put your next offer, and where you've been wasting one.
See every surface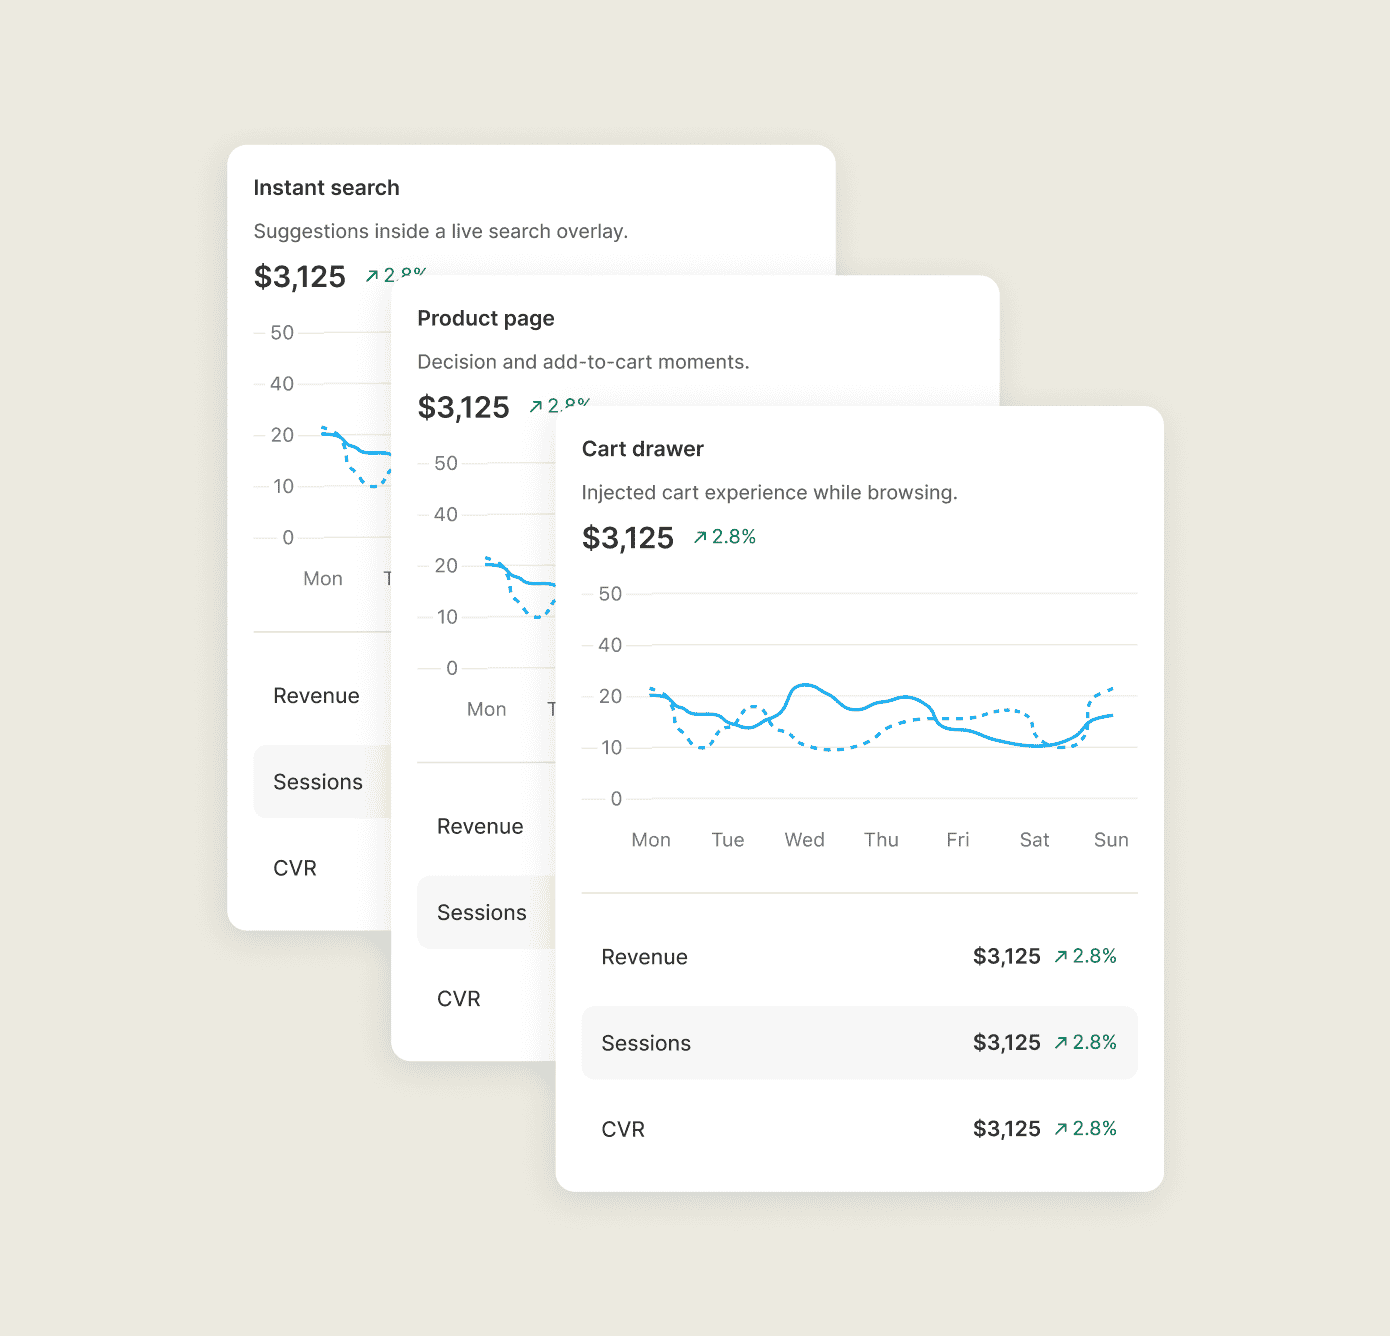
// The journey funnel: where shoppers slip away
Shoppers leave somewhere between landing and buying. You can't see where.
Sessions come in, orders trickle out, and the gap between them is a number you can't act on. Somewhere in there, shoppers searched and found nothing, filtered into an empty page, or got to the cart and walked. Each drop is money. You can't see which one.
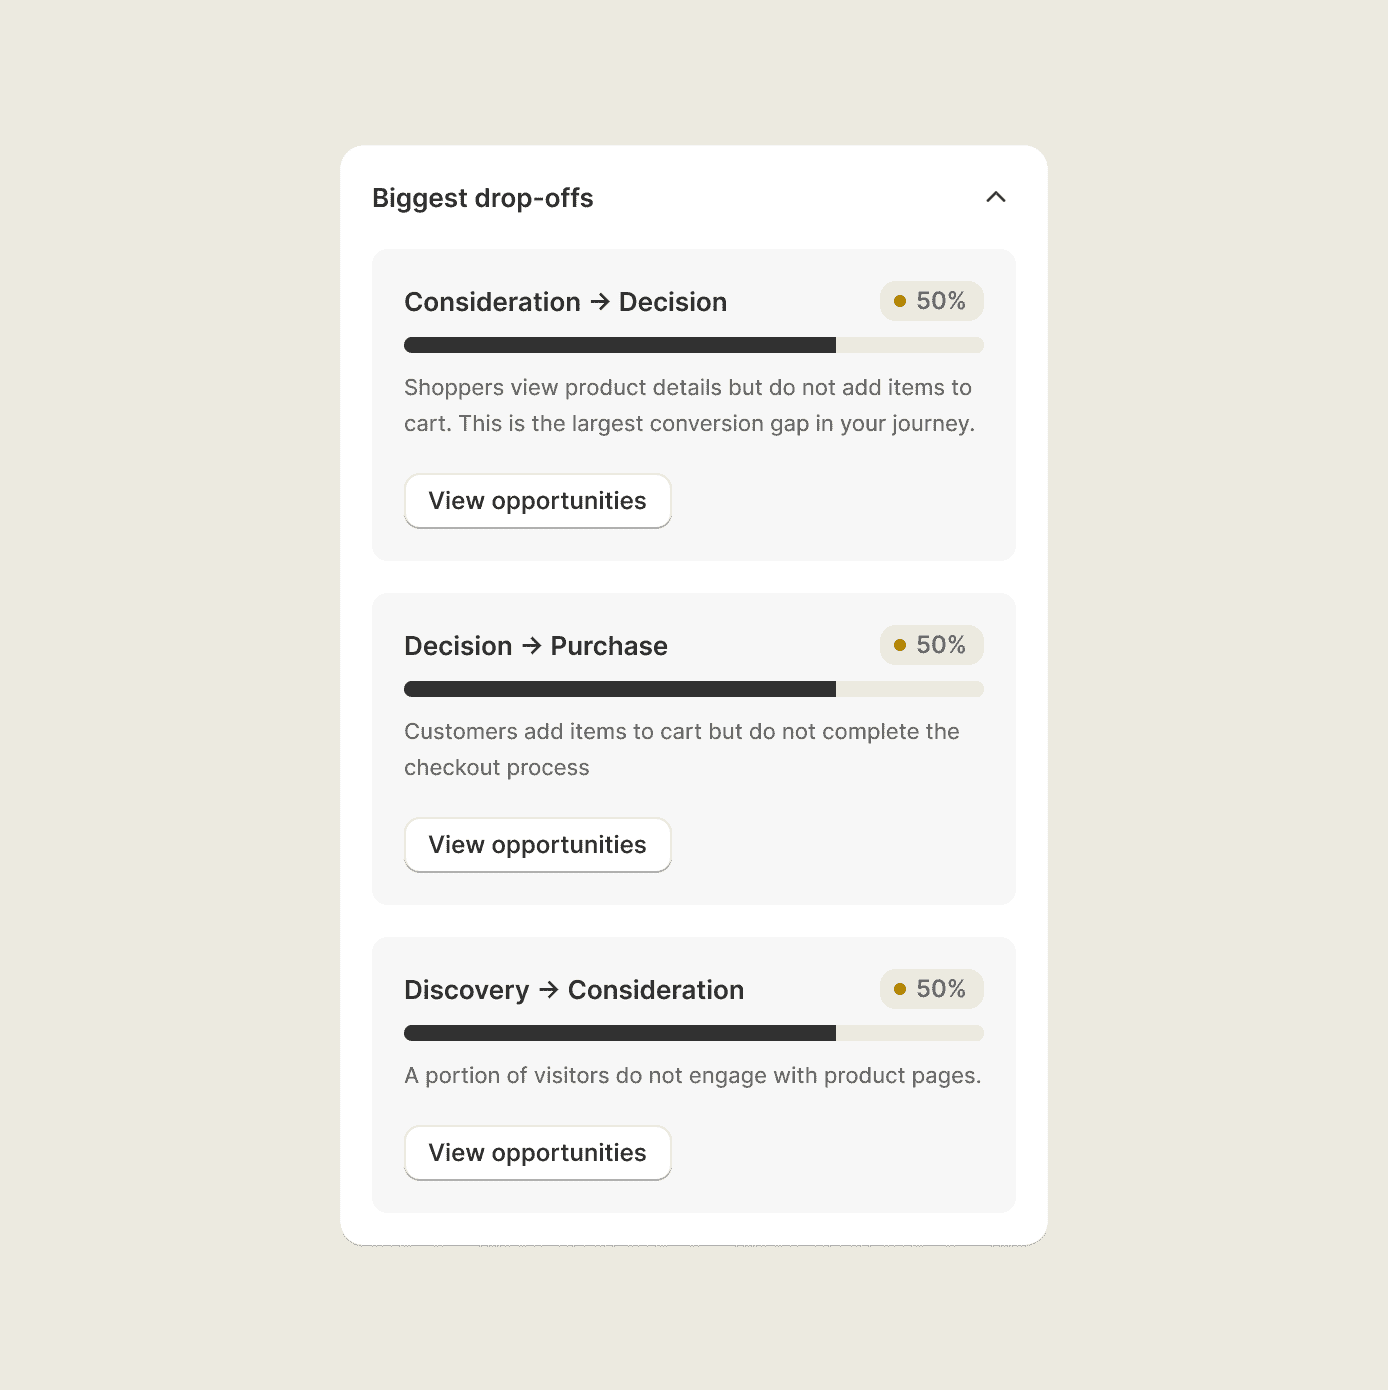
Sledge Analytics gives you a five-stage journey funnel. You see how many shoppers move from one stage to the next. You also see the exact stage where they drop off, and where on your store you are losing the sale.
A large drop right after search often points to a search problem you can fix. A drop at the cart means an offer or a shipping bar could save the sale. The funnel does more than show the leak. It names the stage the leak sits in.
// The payoff: analytics that hands you the move
Even good analytics stops at the "why". You still have to figure out the "what now".
Say a report gets it right: shoppers drop after a no-results search. That much is useful. But it's 9am, and you run the store and the warehouse and the inbox. "Figure out the fix yourself" is one more job you won't get to today. Knowing the why isn't the same as having time to act on it.
Sledge Analytics doesn't stop at the why. It pairs with Growth Intelligence, which reads the same shopper behavior underneath. Growth Intelligence turns the why into a specific move with a dollar estimate: "Shoppers search this and find nothing. Add the synonym. Worth about $210 a month if it lands." You save it and the offer goes live.
Then you find out whether it worked. Sledge tracks the sales your move touched in the two weeks after you save it against the two weeks before, so you see what moved. Analytics that ends in a chart leaves you the work. This ends in a decision.
This all happens inside your store. Sledge Analytics is not an ad-attribution tool and won't reconcile what your ad platform reports against what Shopify reports. Your ad platform tells you what brought the shopper to your store. This tells you what they did on it.
Meet Growth Intelligence
Questions, answered
What does Sledge Analytics show?
Sledge Analytics shows revenue attributed to each feature, revenue attributed to each surface, and a five-stage journey funnel that reveals where shoppers drop off, all inside your store.
Does Sledge Analytics tell me what to do, not just what happened?
Yes. Sledge Analytics pairs with Growth Intelligence, which reads the same shopper behavior underneath and hands you a specific move with a dollar estimate, opened as a pre-filled form you review and save.
Can Sledge Analytics tell me which feature is making me money?
Yes, for the features Sledge runs. Search, filters, bundles, merchandising, and the cart each get their own revenue number, so you can see which one earned the sale and which to keep.
Does Sledge Analytics replace Google Analytics or fix ad attribution?
No. Sledge Analytics attributes revenue to your on-site features, surfaces, and journey stages. It is not a GA4 replacement and does not reconcile ad-channel attribution.
What is the journey funnel?
The journey funnel in Sledge Analytics is a five-stage view of how shoppers move through your store and the exact stage where they drop off, so you can see where you are losing the sale.
Your store leaks. Sledge names the fix.
Install free. Sledge shows you what each feature and each surface earned, and the stage where the most shoppers slip away. Pick a plan and Growth Intelligence turns that into the next move, with a dollar estimate attached.
14-day free trial · No code · Works with any theme · Uninstalls clean