Demand forecasting is estimating how many units of each product shoppers will want in a coming period, so you order enough stock and not too much. At a small online store you usually start from last year's sales for the same weeks, adjust for this year's growth, and don't count sold-out days as zero demand.
Say you ordered 500 pairs of last winter's boot and 200 were still boxed in March. Or you ordered 60 gift sets and sold the last one ten days before Valentine's Day. A forecast puts a number on the next order before either happens.
What is demand forecasting?
Demand forecasting estimates what shoppers will want, not only what you'll sell, because sales stop when a product runs out. A short-term forecast covers the next few weeks and sets your reorders. A long-term one covers the year and sets your budget and shelf space. Demand planning is the step after: turning the forecast into orders.
Buy too much and the extra sits in boxes, tying up cash and adding to your inventory carrying cost. Left long enough, it becomes dead stock. Buy too little and you sell out in your busiest week. Retail and ecommerce demand forecasting are the same job: a number for each product, often for each size, for each season.
What are the main demand forecasting methods?
Demand forecasting methods work from your own sales numbers or, when you have none, from judgment.
| Method | How it works | Use it for |
|---|---|---|
| Same weeks last year | Last year's units for the weeks you're planning | Holidays and seasonal products |
| Moving average | The average of the last few months | Steady sellers |
| Growth adjustment | Multiply by how much faster or slower your store sells than a year ago | On top of either method above |
| Seasonal index | A month's sales divided by an average month, applied to your monthly forecast | Stores with a busy and a slow season |
| Test and judgment | A small first order, pre-orders, a similar product's sales, what your supplier sees | New products with no history |
The first four use numbers, so textbooks call them quantitative. The fifth uses judgment, which makes it qualitative. Large retailers add statistical models and machine learning that weigh price, weather and promotions. At a few hundred orders a month, the five above are where to start.
How is retail demand forecasting different for a small online store?
At a small store you forecast by hand, so start with your best sellers and split each total by size. A total that's right can still leave you out of one size.
Shopify's "ABC product analysis" report grades each item you sell, down to the size and color, by its share of your revenue over the last 28 days. The A grade goes to the top sellers that make 80% of it, B to the next 15% and C to the last 5%. Forecast the A products by hand. Order C products less often or only as you need them, as Shopify's own ABC guide suggests.
Then split the order by size. Say last season's hoodies sold 15% small, 35% medium, 30% large and 20% extra large. An order of 200 becomes 30, 70, 60 and 40. Shopify counts each size and color as its own item, usually with its own SKU, so last season's mix sits in the same reports.
What are some demand forecasting examples?
Each common case has its own sum: a holiday product, a steady seller, a slow month and a new product.
- Holiday product: say a rose candle sold 140 in the four weeks before Valentine's Day 2026, and your store is selling 20% more than a year ago. 140 × 1.2 = 168, so plan on about 170.
- Steady seller: say a ceramic mug sold 52, 61 and 58 in the last three months. Their average, a three-month moving average, is 57, so plan on 57 next month.
- Slow month: say you sold 9,600 units in the last 12 months, 800 in an average month. Last January you sold 600, so its seasonal index is 600 ÷ 800 = 0.75. At an expected 960 a month next year, 800 plus your 20% growth, January comes to 960 × 0.75 = 720.
- New product: say a similar tote sold 90 in its first month. Order 45, half of that, and take pre-orders for the rest. Reorder from what the first two weeks sell.
How do you do demand forecasting in Shopify?
Shopify has no forecast report, so you build one from what its reports hold: last year's units, this year's growth and the stock on your shelf. Shopify's own list of built-in inventory features marks forecasting as not supported. Stocky, Shopify's inventory app, closed on August 31, 2026.
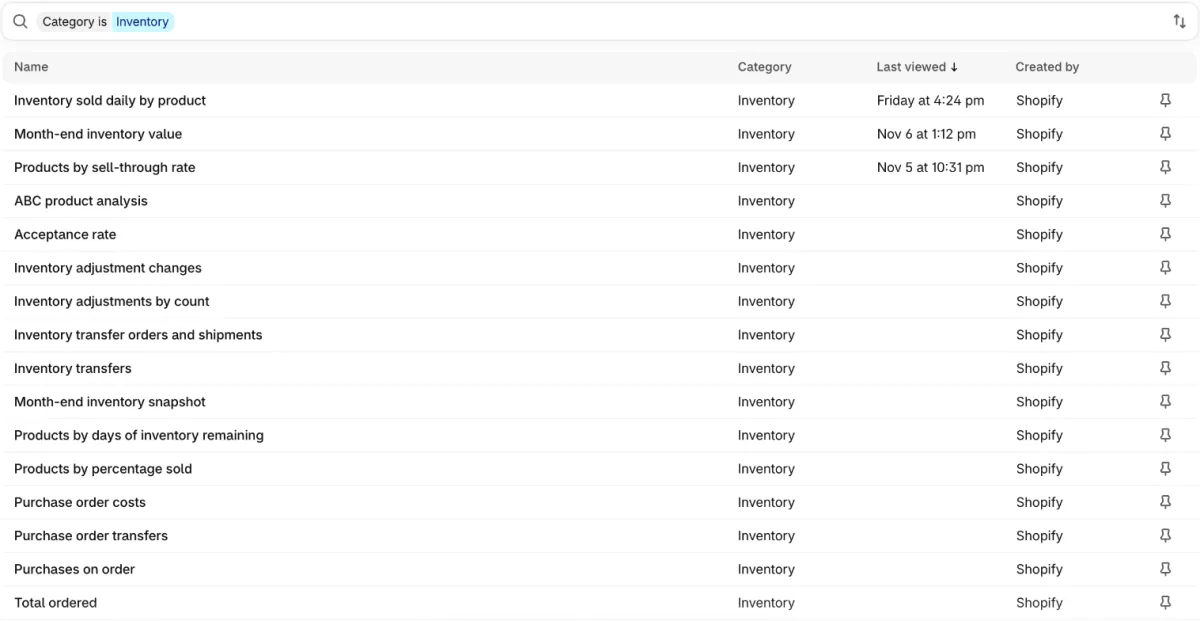
- Pull last year's units. In your Shopify admin, go to Analytics, then Reports, and filter the list in its search box to "Category is Inventory", so only inventory reports show. Open "Inventory sold daily by product", the report of units sold and units left for each product and size. Its data goes back to October 1, 2023. "Total sales by product", under Sales, also works: its "Net quantity" is items sold minus items returned.
- Pick the same weeks. Set a custom date range for the weeks you're planning, one year back. Match weekdays where you can, because a holiday's weekday moves: Valentine's Day 2026 fell on a Saturday, and 2027's falls on a Sunday.
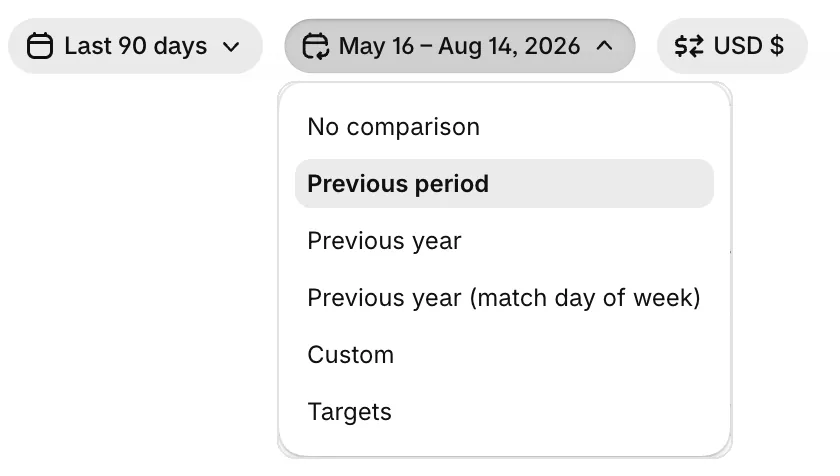
- Measure this year's growth. Set the date range to the last 90 days. The button beside it, showing a second set of dates, opens the comparison menu. Pick "Previous year", the same days a year back. Say you sold 1,200 units against 1,000: your store is selling 20% more.
- Clean, then adjust. Count the days a product was sold out at the pace it sold on the other days, because zero sales there means missing stock, not missing demand. Drop one-off bulk orders and promotions you won't repeat. Multiply the total by your growth rate.
- Turn it into an order. Take the forecast, add a cushion of safety stock, and subtract the stock you hold and any already on its way. For the candle, a forecast of 170, plus a cushion of about 40 (a week at the season's pace), minus the 40 on hand, is an order of 170. Place it early enough to cover your supplier's lead time, and record it as a purchase order under Products, then Purchase orders.
For a product you reorder all year, economic order quantity works out how many to buy each time. Shopify's help says Sidekick, its admin assistant, can help forecast demand and suggest what to reorder from your sales data. Check its answer against your own sums.
How do you count the sales you missed while sold out?
Your reports count orders, not the shoppers who left because a product was gone, so a stockout makes next season's forecast too small. Shopify's inventory reports list units sold, stock left and sell-through.
Two habits catch some of that demand. When a restock date is close, tick "Continue selling when out of stock", the product setting that takes orders at zero, and those backorders show what shoppers wanted. Without a date, collect emails with a back-in-stock form.
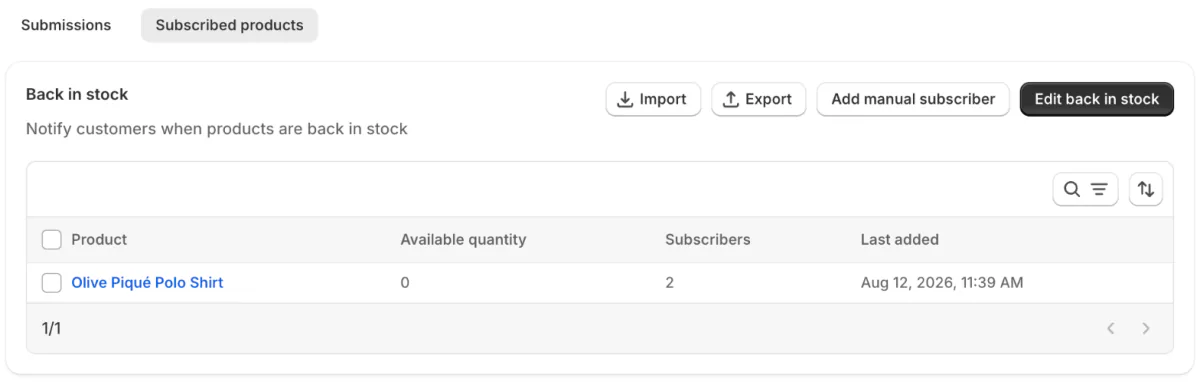
Sledge, a Shopify app for search, merchandising and store analytics, counts two kinds of missed demand. On a paid plan, the Signals tab in Sledge Analytics marks a product "Sold out but wanted" and shows how many visits found it sold out over the past week. It counts only visits that saw the product with every size and color gone, in Sledge's search results, collections or recommendations. It lists up to three products, each seen in at least 50 visits. On Accelerate and up, Back in Stock has a "Subscribed products" tab that shows each product's sign-ups beside its available quantity, per product rather than per size. Sort it by "Most subscribers" to put the most-wanted products first.
Visits aren't orders, so use them to decide whether to round a forecast up. Sign-ups come closer to units.
When should you order stock for January, Valentine's Day and spring?
Count back from the day sales start by your full lead time, from sending the purchase order to having stock you can sell. Say your supplier needs six weeks, door to shelf:
| Season | Pull from last year | Stock in by | Order by |
|---|---|---|---|
| January | January 1 to 31, 2026 | January 1, 2027 | November 20, 2026 |
| Valentine's Day, Sunday, February 14, 2027 | January 15 to February 14, 2026 | January 15, 2027 | December 4, 2026 |
| Spring launch | Your first six weeks of spring sales, say March 1 to April 11, 2026 | March 1, 2027 | January 18, 2027 |
January's order comes due first, on November 20. Plan the promotions that drive those weeks in your content calendar.
How do you know if your forecast was right?
After the season, compare the forecast with units sold for each product, and count a sell-out as a miss, not a win. Say you forecast 170 units and sold 150. The forecast ran 13% high: 20 over the 150 you sold. Had you stocked only 150 and sold out on February 8, though, 150 would be only a floor, and you couldn't tell how many more shoppers wanted one.
During the season, Shopify's "Products by days of inventory remaining" report divides your stock by the daily pace of the last 28 days. Just before a peak, it shows more days than your stock will last. Say a product sold 56 in the last 28 days, 2 a day, and 100 are left: the report shows 50 days. At a Valentine's pace of 5 a day, those 100 last 20.
Sledge's Signals tab works from recent sales too. Its "Best seller running low" entry appears when a product that sold 10 or more units in the last 30 days, by Sledge's count, has under a week of stock left at that pace. It lists up to five products and counts all sizes together. Before a peak, it comes late for the same reason. For Shopify's low-stock email and its other reorder reports, see how to know when to reorder.
FAQ
Questions, answered
-

14-day free trial
Explore Sledge on your store before you decide to commit.
-

No credit card required
Start improving your store with no upfront commitment.
-

Setup in minutes
Get Sledge running without a lengthy setup process.
-

Built to grow sales
Turn shopper behavior into actions that help you sell more.
What is demand forecasting?
Demand forecasting is estimating how many units of each product shoppers will want in a coming period, such as a season or the next month. It differs from a sales forecast because sales stop when stock runs out. You use it to decide how much to order, and when.
What are the main demand forecasting methods?
Most methods fall into two groups. Quantitative methods use your sales history: the same weeks last year, a moving average, a growth adjustment and a seasonal index. Qualitative methods use judgment when there is no history, such as a small first order, pre-orders or a similar product's sales. Large retailers add statistical models on top.
What is an example of demand forecasting?
Say a rose candle sold 140 in the four weeks before last Valentine's Day, and your store is selling 20% more than a year ago. 140 times 1.2 is 168, so plan on about 170. Add a cushion of about 40, take away the 40 on hand, and order 170.
Does Shopify have demand forecasting?
Not as a report. Shopify's own list of built-in inventory features marks forecasting as not supported. Its reports hold the numbers: Inventory sold daily by product for last year's units, and a report of days of stock left at the last 28 days' pace. Shopify's help says Sidekick, its admin assistant, can also help forecast demand.
How much sales history should a forecast use?
Match the window to the product. A seasonal product needs the same weeks last year. For a steady seller, use the last three months, and for a new or trending product, the last two to four weeks. Leave out days it was sold out, because zero sales there means no stock, not no demand.
Does Sledge forecast demand?
No. Sledge doesn't forecast demand, place orders or change stock counts. On a paid plan, its Signals tab marks a product Sold out but wanted and flags a best seller with under a week of stock left at its last 30 days' pace. From Accelerate up, Back in Stock shows sign-ups per product beside available stock.
See what shoppers wanted while it was sold out
Sledge doesn't forecast demand, write purchase orders or touch your stock counts. On a paid plan, its Signals tab lists the products shoppers came across sold out and flags a best seller with under a week of stock left at its last-30-days pace. Try Sledge free for 14 days. Growth Intelligence turns on when you pick a paid plan, and its suggested fixes add up to one dollar figure, labeled Est. potential.