What is economic order quantity (EOQ)?
Economic order quantity, or EOQ, is the number of units to buy in one order so that placing orders and storing stock cost the least over a year. Sell 2,400 mugs a year, pay $40 an order and $2 a year to hold one, and the economic order quantity formula says to order about 310.
How do you calculate economic order quantity?
EOQ = √(2DS ÷ H). D is the units you sell a year, S is what one order costs and H is what holding one unit for a year costs.
Economic order quantity formula example
For the mugs, 2 × 2,400 × $40 ÷ $2 is 96,000, and its square root is about 310. That is about eight orders and $620 a year, half to place and half to hold. Ordering 100 at a time costs $1,060. Ordering 350 costs $624.
What are ordering cost and holding cost?
Ordering cost is what one order costs whatever its size, such as staff time and a shipping fee. Holding cost is what keeping one unit for a year costs: storage, insurance, damage and tied-up cash. It is often a share of the unit's cost, the holding rate: 20% of a $10 mug is $2. For your holding rate, see inventory carrying cost.
When does the EOQ formula not work?
Shopify's EOQ guide lists what the formula assumes, including steady demand, a known delivery time and no volume discount. With a volume discount, compare yearly totals, goods included, at your EOQ and at the discount quantity. A supplier's minimum above your EOQ wins.
Is EOQ the same as reorder quantity?
Reorder quantity is what you order each time, and EOQ is one way to set it. When to order is your reorder point, which safety stock raises.
Does Shopify calculate EOQ?
Shopify's Analytics reports do not work out how much to order, so gather the numbers yourself. For D, open Analytics, then Reports, set the Category filter to Inventory and open "Inventory sold daily by product". Set the period to the last 12 months and show the metric "Inventory units sold" for each size and color. The report covers only products whose stock Shopify tracks. For H, multiply a product's "Cost per item", what one unit costs you, by your holding rate.
When stock runs low, with Sledge
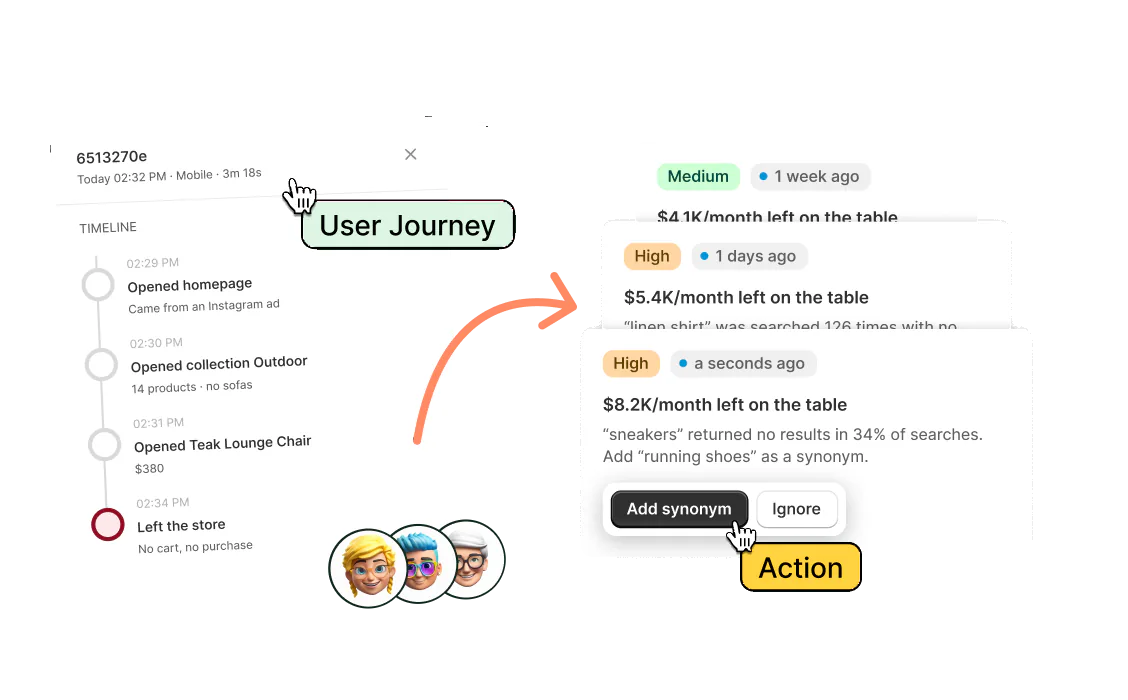
The Signals tab in Sledge Analytics flags "Best seller running low": a product that sold 10 or more in 30 days with under seven days of stock left. On a paid plan, Growth Intelligence totals what its fixes could add as one dollar figure, labeled "Est. potential", and compares your sales before and after each fix you set up.