What is churn rate?
Churn rate, or attrition rate, is the share of customers you lose over a period. A store has no cancel button, so a lost customer is one who went well past their usual time between orders without buying again. If 400 customers ordered in spring and 120 ordered again in the next six months, your churn rate is 70%.
How do you calculate churn rate?
Churn rate = customers lost ÷ customers at the start × 100. Shopify's blog counts a customer as lost after twice your usual time between orders: if buyers reorder every three months, check at six. For the spring buyers, 280 lost ÷ 400 = 70%, near the 75% that post calls average for fashion or skin care. Subscription churn counts cancellations instead.
Customer retention rate vs churn rate
Retention rate is the share who ordered again: 100% minus churn. Retention rate = (customers at the end − new customers) ÷ customers at the start × 100. Say 350 customers ordered in the six months after spring, 230 of them new: (350 − 230) ÷ 400 = 30% retained. Skip that subtraction and 350 ÷ 400 reads as 88%: new buyers hide the ones you lost.
Shopify's returning customer rate differs: returning customers ÷ everyone who ordered, so a rush of new buyers pulls it down.
Where does Shopify show churn and retention?
Shopify reports retention, the other side of churn. In Analytics, open Reports and pick Customers in the Category filter. "Customer cohort analysis" groups buyers by month of first order. Set its Metric menu to "Customer retention rate" to see what share of each month's buyers ordered again in each month after. Compare months at the same age: newer buyers have had less time to return.
How do you improve customer retention rate?
Every customer you keep raises customer lifetime value without a new ad. Churn rate analysis starts in the cohort report: filter it by first product or marketing channel. Start with the group that returns least. "RFM customer analysis" puts regulars who have gone quiet in its "At risk" group. Click that group, then Preview segment, for a list to email. The rest is in how to get repeat customers.
Repeat buyers, with Sledge
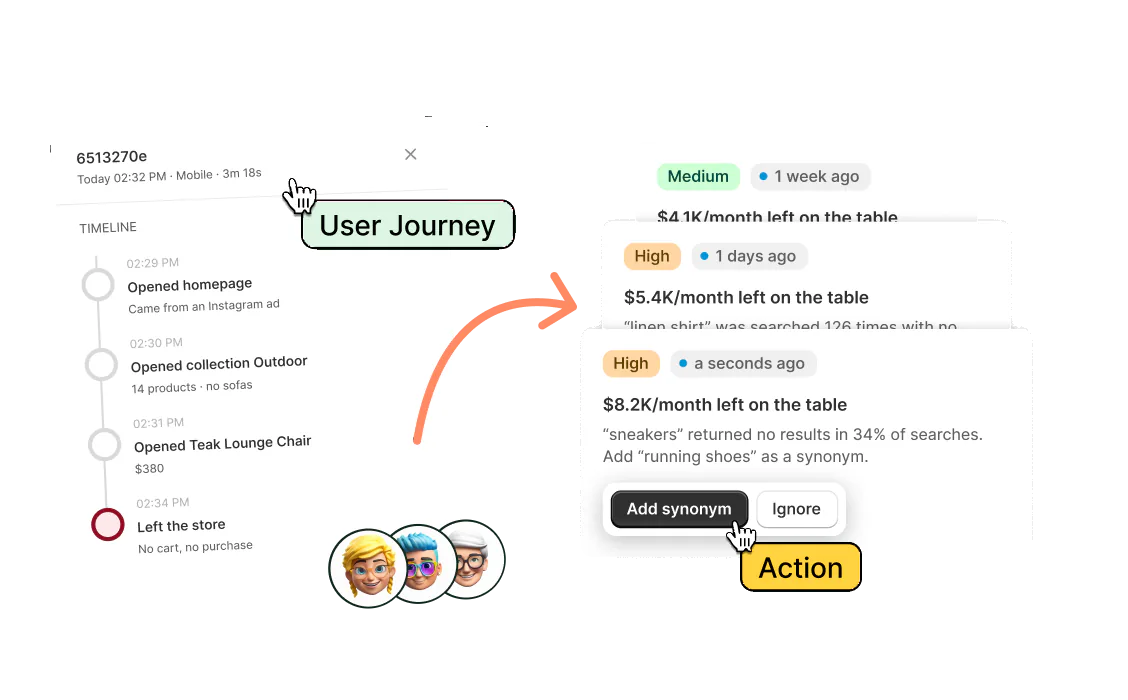
Sledge does not report churn or retention rate. The Signals tab in Sledge Analytics can show "Fewer repeat buyers" when a much smaller share of recent buyers ordered again than in the weeks before. Growth Intelligence turns on when you pick a paid plan. It can flag when too few customers buy a second time and suggest a fix. It sums what its fixes could add into one estimate in dollars, labeled "Est. potential", and each fix you set up is measured against sales through Sledge.