What is the inventory turnover ratio?
The inventory turnover ratio is how many times you sell through your stock in a period: cost of goods sold divided by your average inventory, both counted at what the goods cost you. A yearly ratio of 4 means your stock sold through four times, about once every 91 days.
How do you calculate inventory turnover ratio?
Inventory turnover ratio = cost of goods sold ÷ average inventory. Average inventory adds your stock's value at the start and end of the period, then halves it. For seasonal stock, average the value at each month-end instead.
Inventory turnover ratio example
Say the goods you sold last year cost you $120,000. Your stock was worth $35,000 at cost on January 1 and $25,000 on December 31: an average of $30,000. Turnover is $120,000 ÷ $30,000 = 4. Days of inventory is 365 ÷ 4: stock sits about 91 days, on average, before it sells.
What is a good inventory turnover ratio?
Shopify's guide calls 4 to 8 turns a year good, but it depends on what you sell: compare with last year. A low ratio means cash sitting in goods that can become dead stock. A high one is good until you sell out, which safety stock guards against.
Work it out per product: a store-wide 4 can hide a jacket nobody has bought since spring. To check one season's stock in units, sell-through rate is quicker.
How do you find inventory turnover in Shopify?
No Shopify report shows turnover, but two hold its halves. In Analytics, open Reports. "Cost of goods sold by order" totals what your sales cost over any period, and "Month-end inventory value" gives your stock at cost on the period's last day. Both skip products with no "Cost per item", what one unit cost you, so fill it in for each product, size and color. A cost added today won't reach older orders. For turnover per product, "Gross profit by product" shows what each product's sold units cost you. "Products by days of inventory remaining" shows each item's days of stock left, from its last 28 days of sales. Read turnover beside your other ecommerce KPIs.
Slow sellers and fast ones, with Sledge
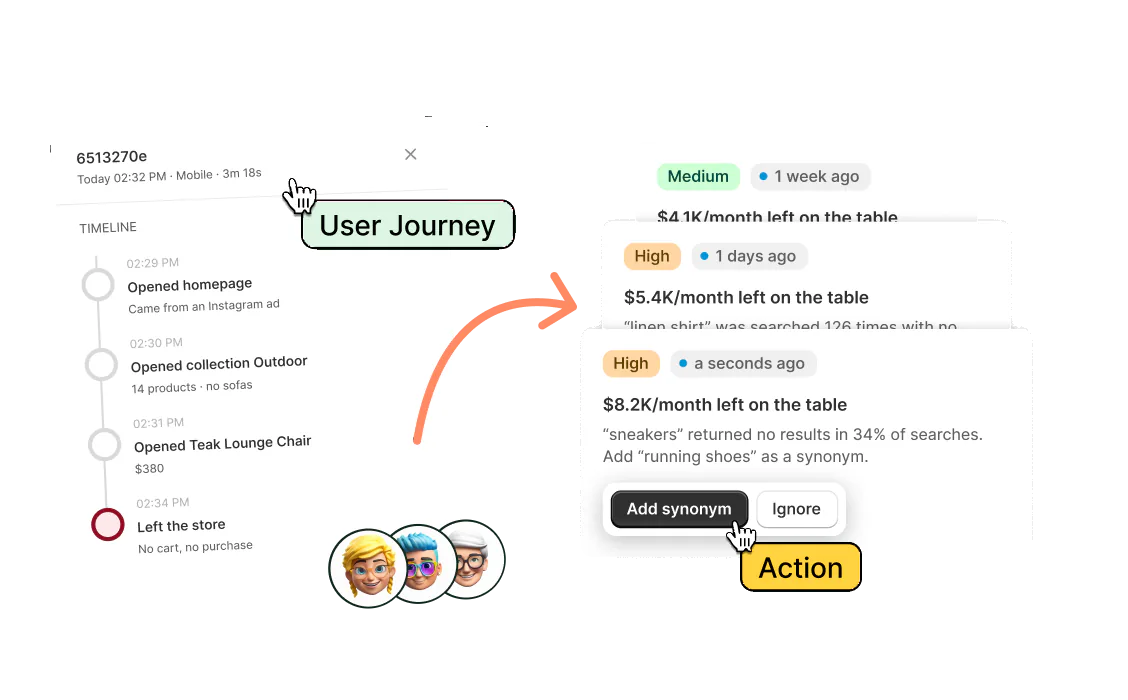
Sledge does not work out your turnover ratio. In Sledge Analytics, the Signals tab can flag "Stock not selling", stocked products that sold nothing in 30 days, and "Best seller running low", a steady seller with under a week of stock left. On a paid plan, Growth Intelligence can spot products with no sales in 90 days and suggest a merchandising rule to move them up. It totals what its fixes could add as one figure in dollars, labeled "Est. potential".