How to review your Shopify Black Friday results
Part 10 of 10 in the Black Friday series
Summarize with AI
Shopify's own comparison tool has a preset date range named, exactly, Black Friday Cyber Monday. It's built into the reports you already have. It just stops at showing you the numbers.
The offer that discounted the most isn't always the one that made money. Some of that revenue would have sold anyway. Without a clear read, the two look identical on a sales report, and by the time anyone sits down to check, the details have already started to fade.
Shopify already named this moment, it just stops there
Open a comparison report and one of the preset date ranges is named Black Friday Cyber Monday, sitting next to options like Month to date and Last 7 days. Shopify built the shortcut. What it doesn't have is a page that tells you what to do once you've opened it: its own BFCM guidance is entirely about setup beforehand, discounts, checkout, order processing, with a single line acknowledging that reviewing what worked matters, and nothing past that line.
That gap is where most of the read-back happens by hand. The reports exist. Turning them into one decision for next year is the part nobody wrote a guide for.
What the native reports actually tell you
Total sales over time gives you orders and revenue across the window you pick. Sales by discount codes groups that revenue by the discount's name, useful for seeing what sold under each offer, silent on what that offer cost you or whether the sale would have happened at full price anyway. Sessions by referrer shows where traffic came from; the Finance summary rolls sales, payments, and gross profit into one card. None of the four are gated by plan.
| Question | Shopify native | Sledge |
|---|---|---|
| What it shows | Sales, sessions, and discount names over a date range you pick | Revenue and trend attributed to each feature and finding, tracked daily |
| How far back it reaches | Varies by report; a BFCM preset is built in | 30 to 120 days of history, by plan |
| What it tells you to do next | Nothing, you draw the conclusion | Names the next move, with a dollar estimate |
One more thing worth knowing before you treat any of it as final: refunds, returns, edits, and cancellations count as sales reversals, and they revise net sales as they're processed, sometimes weeks later. A number pulled the morning after is a first read, not the last one.
Why the discount that "won" might not be the one that paid
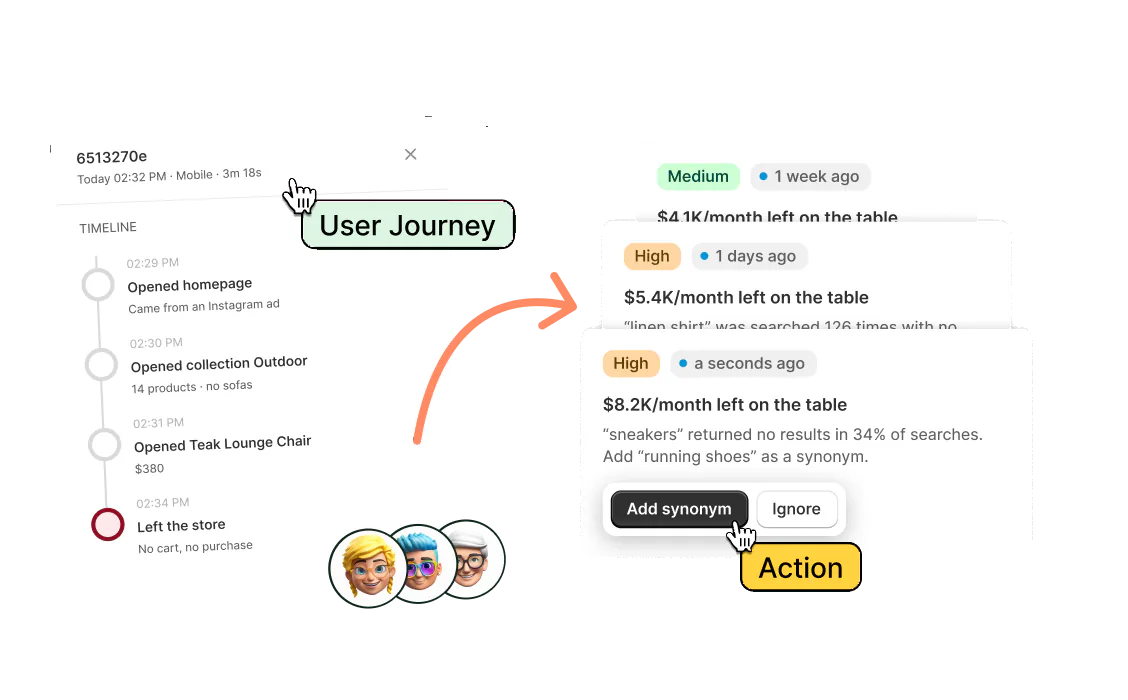
Sales by discount codes still won't tell you what each offer cost against what it earned, or which one you'd run again. Growth Intelligence keeps a Performance view on every finding instead: revenue attributed to that feature, trending day by day rather than one number for the season. Same question, which offer made money, with the arithmetic already done.
That daily detail is what a single sales report can't give you. A discount that spiked on the Friday and did nothing the rest of the weekend reads differently from one that held steady, even if the season total looks the same.
The window that closes before you sit down to look
Analytics history is plan-gated: 30 days on Pro, 60 on Scale, 90 on Accelerate, 120 on Ultimate. Black Friday 2026 falls on 27 November. On Pro, that 30-day window is already gone by any date in January, the exact month the read-back is supposed to happen. Scale's 60 days survives only the first few weeks of January. Accelerate and Ultimate hold the whole month without anyone needing to rush.
Worth checking before the season, not after: which window your plan gives you, and whether the date you've picked for the read-back still falls inside it.
Before you call the season reviewed, check these
- Shopify's Black Friday Cyber Monday comparison preset is pulled first, before anything built by hand.
- Discount performance is read against margin, not against revenue alone.
- Referrer data is checked against what you actually paid for that traffic.
- Numbers from the first week are treated as provisional until reversals settle.
- Your Sledge plan's history window still covers the date you're reading back on.
- One offer or fix is named for next year, not a list of everything that could change.
- The January date is already on next year's calendar, not just this one.
FAQ
Questions, answered
-

14-day free trial
Explore Sledge on your store before you decide to commit.
-

No credit card required
Start improving your store with no upfront commitment.
-

Setup in minutes
Get Sledge running without a lengthy setup process.
-

Built to grow sales
Turn shopper behavior into actions that help you sell more.
How do I compare my Black Friday sales to last year on Shopify?
Open a sales report and use the comparison tool's preset date range named Black Friday Cyber Monday, rather than picking custom dates by hand. Shopify names the exact window for you; it just doesn't tell you what to do with what you find.
Which Shopify report shows which discount actually worked?
Sales by discount codes, under your sales reports. It groups revenue by the discount's name, which tells you what sold under each offer, not what that offer cost you or whether it would have sold anyway. Read it against your margin, not on its own.
Why do my Black Friday numbers change after the sale is over?
Refunds, returns, edits, and cancellations count as sales reversals, and they revise net sales as they're processed, which can be days or weeks later. A number pulled the morning after is a first read, not a final one.
How long does Shopify keep my analytics data?
Shopify doesn't publish a fixed cutoff for most reports, though it notes that session-based metrics only go back to October 2022 and inventory-based metrics to October 2023. Its own comparison tool includes a preset for Black Friday Cyber Monday specifically, so the window you need is there.
How far back does Sledge's Growth Intelligence keep my data?
30 days on Pro, 60 on Scale, 90 on Accelerate, 120 on Ultimate. Black Friday 2026 is 27 November. On Pro, that 30-day window has already closed by any date in January. On Scale, it closes partway through January itself. Accelerate and Ultimate hold the whole month.
What should I actually check first in my Black Friday read-back?
Start with Shopify's own Black Friday Cyber Monday comparison, then read discount performance against margin rather than revenue alone. Growth Intelligence, if you run it, already tracks revenue and trend per feature daily, so the read-back is mostly confirming what it found, not starting from a blank report.
The read-back has a deadline, whether anyone put it on the calendar or not.
Install free. On a paid plan, Growth Intelligence keeps daily revenue and trend on every feature all season, up to 120 days back on Ultimate, so the read-back in January still has November in it. Each finding carries a dollar estimate, from your own orders and from published research on what changes like these earn.